- AI Fire
- Posts
- 💡 ChatGPT For Data: From Raw Data To Insight In Minutes
💡 ChatGPT For Data: From Raw Data To Insight In Minutes
Stop fearing complex spreadsheets. This guide provides a simple framework and prompts to use ChatGPT for expert-level data analysis and make decisions fast.
Neil Phan
December 05, 2025
What's your biggest challenge when analyzing a new dataset? |
Table of Contents
Introduction: From Data Chaos To Instant Clarity
Most of us work with data daily, but very few have been formally trained on how to analyze it effectively. Whether you're a management consultant, an account manager, or a product marketing manager, data analysis is an indispensable part of your job - but it doesn't have to be intimidating.

In today's business world, the ability to transform raw data into strategic insights is no longer a "nice-to-have" skill; it has become a fundamental requirement. However, technical and psychological barriers often prevent many professionals from fully harnessing the potential of the datasets they possess. The fear of complex formulas, specialized software, and a lack of clear direction can turn an analysis task into hours of inefficient work.
This comprehensive guide will break down those barriers. We will introduce a proven, three-step framework called DIG (Description - Introspection - Goal Setting) that turns ChatGPT into your personal data analyst. No technical skills are required. By the end of this article, you will be able to understand any dataset in minutes instead of hours and extract deep insights that would normally take a trained data analyst to find.
The DIG Framework: Your Detailed Blueprint For Data Analysis
The framework we'll use is called DIG - short for Description, Introspection, and Goal Setting. This isn't a random system; it's built upon the industry-standard EDA (Exploratory Data Analysis) approach, simplified to suit non-technical professionals.

EDA is the foundation of modern data science, a philosophy that emphasizes approaching data with an open mind, using visualization and statistical techniques to summarize its main characteristics before diving into formal modeling. The DIG framework is the democratized version of EDA, making its power accessible to everyone.
Here’s how it works: When you receive a spreadsheet with no context, you're at 0% understanding. But with each structured DIG prompt you input into ChatGPT, your understanding increases dramatically. By the end of the process, you'll have insights that might have taken hours to find manually - if you could find them at all.
Think of it as a simple chart: Start at zero, then gradually build your knowledge with each structured prompt until you achieve complete clarity about your data.
Step 1: Description - Understanding The Data You're Working With
The Challenge: Decoding Unfamiliar Data

Imagine this scenario: a colleague abruptly resigns, leaving you with a spreadsheet containing thousands of rows of last quarter's marketing campaign performance data. No explanation, no context, nothing. This is where the Description step saves the day.
The goal here is simple: have ChatGPT explain what's in your file as quickly and effectively as possible. This step is equivalent to a craftsman inspecting all their tools before starting a major project.
Prompt 1: Discover The Overall Data Structure
Start with this detailed prompt. Instead of just asking for column names, request a deeper analysis:
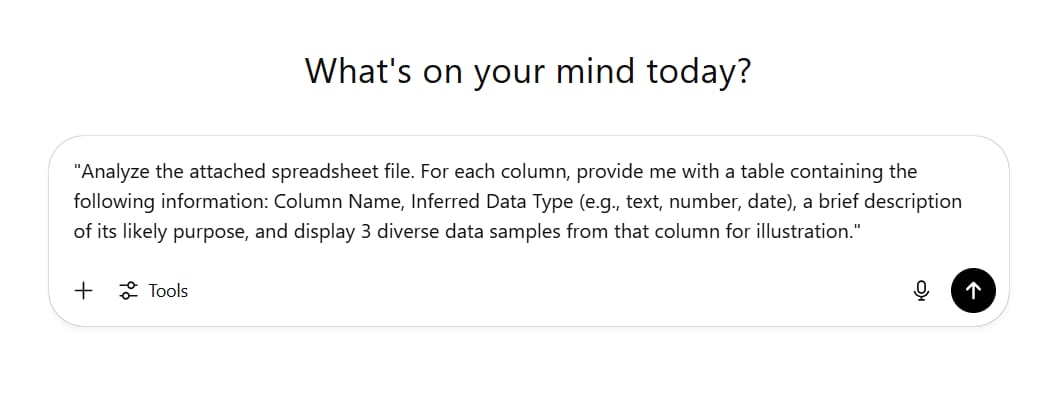
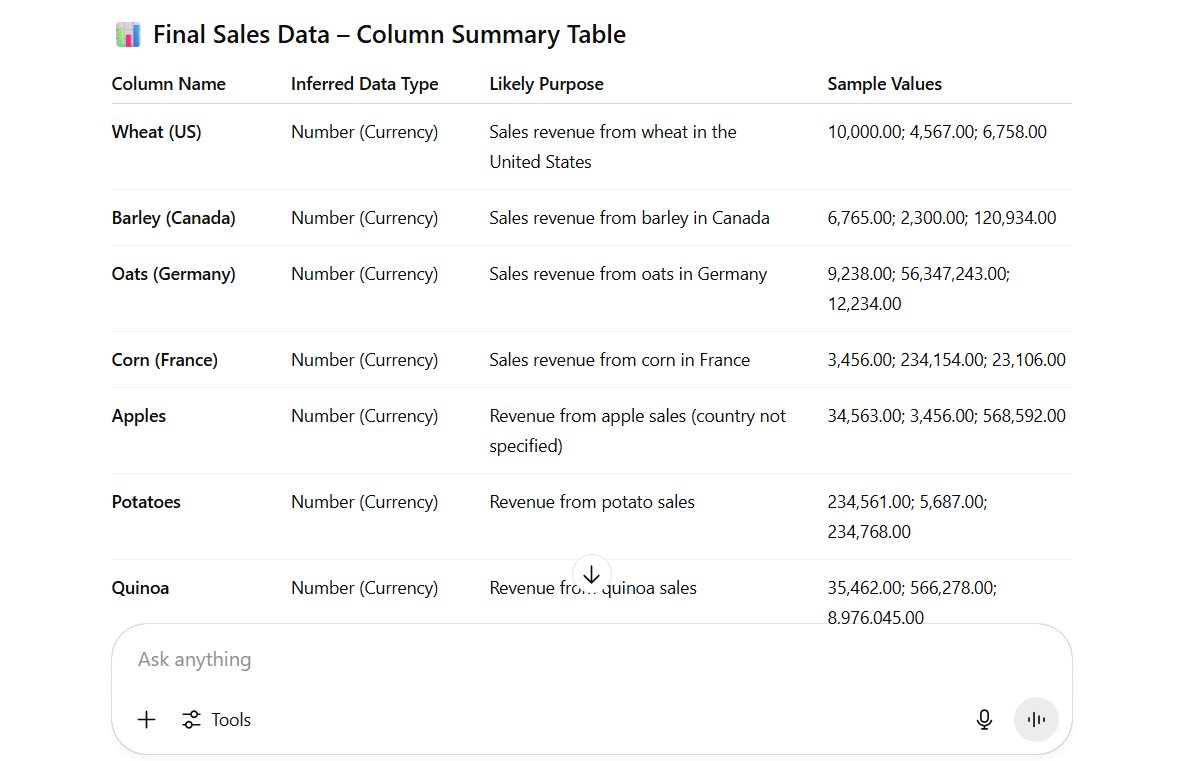
"Analyze the attached spreadsheet file. For each column, provide me with a table containing the following information: Column Name, Inferred Data Type (e.g., text, number, date), a brief description of its likely purpose, and display 3 diverse data samples from that column for illustration."Why it works: This prompt forces ChatGPT to systematically examine and interpret every single column. Instead of you having to scroll through endless rows trying to understand everything, you get a clean, digestible summary. The response will immediately help you:
Clearly list all columns.
Understand the data formats (numbers, text, dates, etc.).
Form an initial hypothesis about the meaning of each column.
This prompt can detect potential issues from the very beginning. For example, you might notice the 'Creation Date' column is formatted as an Excel serial number instead of a readable date format, or the 'Region' column contains both country and city names in the same text string. Document these issues immediately.
Learn How to Make AI Work For You!
Transform your AI skills with the AI Fire Academy Premium Plan - FREE for 14 days! Gain instant access to 500+ AI workflows, advanced tutorials, exclusive case studies and unbeatable discounts. No risks, cancel anytime.
Prompt 2: Assess Distribution And Uniqueness
Next, dig deeper into the nature of the data:
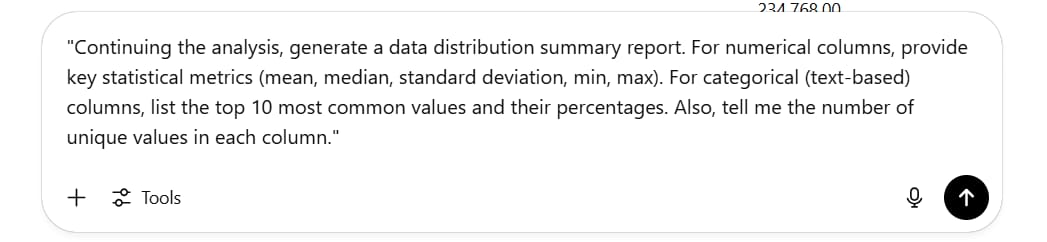
"Continuing the analysis, generate a data distribution summary report. For numerical columns, provide key statistical metrics (mean, median, standard deviation, min, max). For categorical (text-based) columns, list the top 10 most common values and their percentages. Also, tell me the number of unique values in each column."Why this is important: This prompt helps you understand the "shape" of your data.
You might discover that 90% of revenue comes from just 2 products.
You might see that the "Status" column only has three unique values: "Completed," "In Progress," "Cancelled."
It helps you identify columns with high variability (many unique values) versus those with high consistency.
Prompt 3: Comprehensive Quality Check
This is a crucial step to avoid drawing flawed conclusions later:
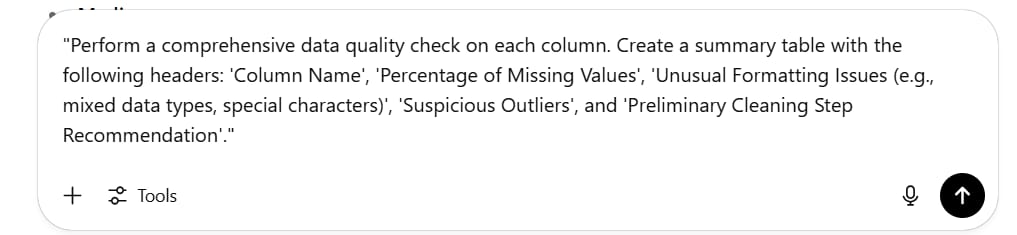
"Perform a comprehensive data quality check on each column. Create a summary table with the following headers: 'Column Name', 'Percentage of Missing Values', 'Unusual Formatting Issues (e.g., mixed data types, special characters)', 'Suspicious Outliers', and 'Preliminary Cleaning Step Recommendation'."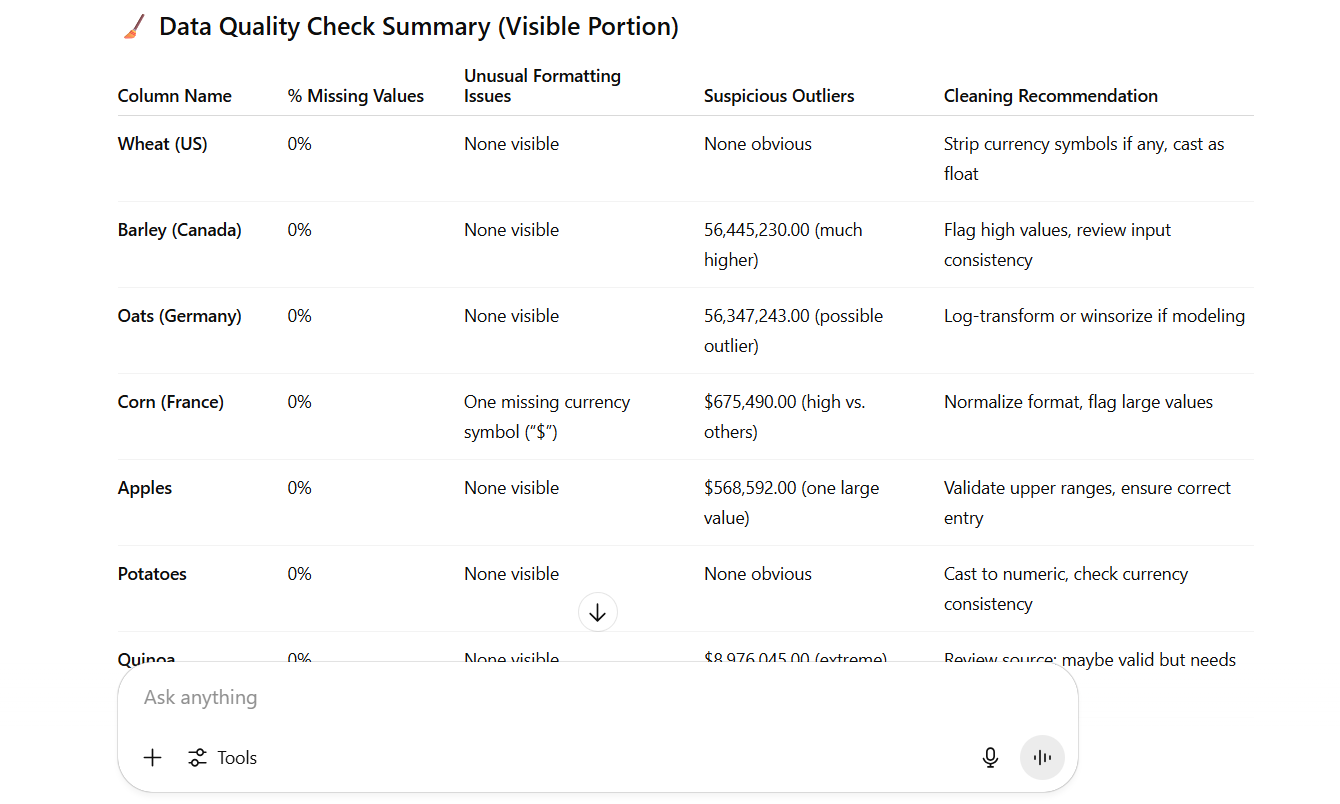
This prompt turns ChatGPT into your quality control inspector. It will automatically scan and generate a detailed report, helping you identify "red flags" in the data. For instance, if you discover that the "Customer Country" column is 99.7% empty, you immediately know that any geography-based analysis would be meaningless and unreliable. This saves you from hours of going down the wrong path.
Real-World Example: Customer Feedback Dataset

Let's apply this to a real-world dataset of customer feedback. The Description step revealed:
The dataset had 10 columns, including Customer ID, Feedback Date, Rating (1-5), Feedback Content, and Product Category.
The 'Feedback Date' column had some entries in "dd/mm/yyyy" format and others in "mm-dd-yy" format.
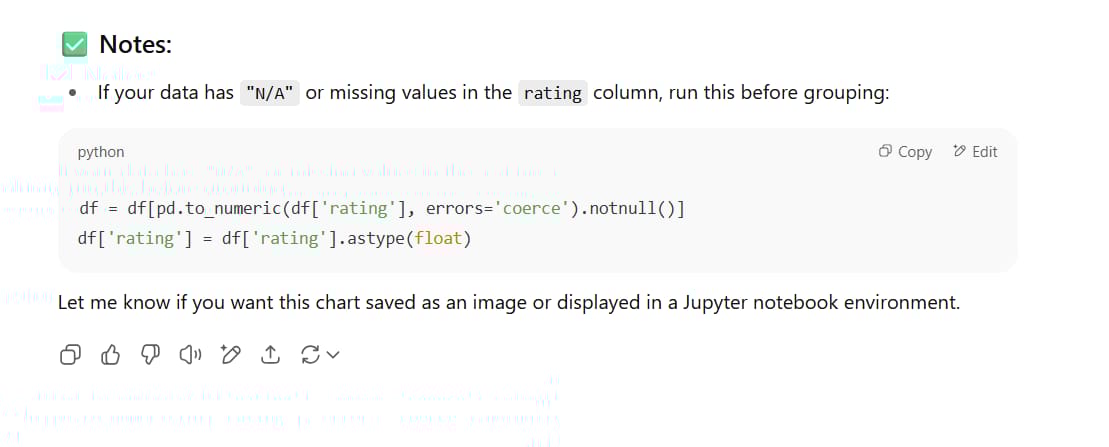
The 'Rating' column had a few values of "N/A" instead of numbers.
The 'Customer ID' column had 9% missing values, which could affect the tracking of individual customer behavior.
This information, gathered in just a few minutes, guided the necessary data cleaning steps and prevented time-consuming, flawed analyses.
Step 2: Introspection - Letting AI Brainstorm For You
The Power Of AI-Generated Questions

The Introspection step is where the real magic happens. ChatGPT transforms from a data describer into a strategic brainstorming partner. Instead of you wracking your brain for what questions to ask, you let the AI suggest interesting questions based on the data's structure and content.
This step serves two main purposes:
Tests the AI's "understanding": High-quality questions show that ChatGPT has truly understood the context of your data. Poor or unanswerable questions indicate a misunderstanding that needs to be corrected.
Sparks inspiration: It can surface perspectives and analytical opportunities you might have missed.
Prompt 1: Generate Insightful Analytical Questions
Use this role-playing prompt:
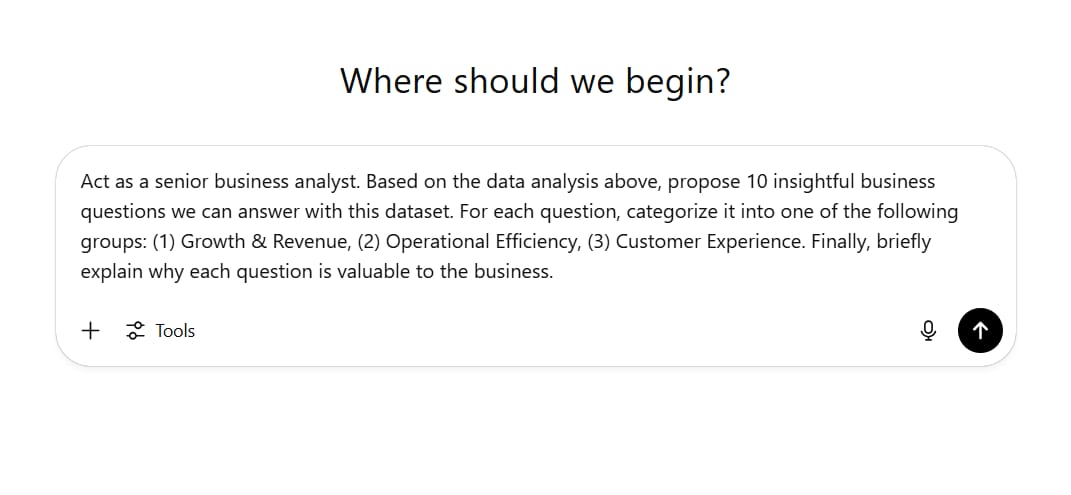
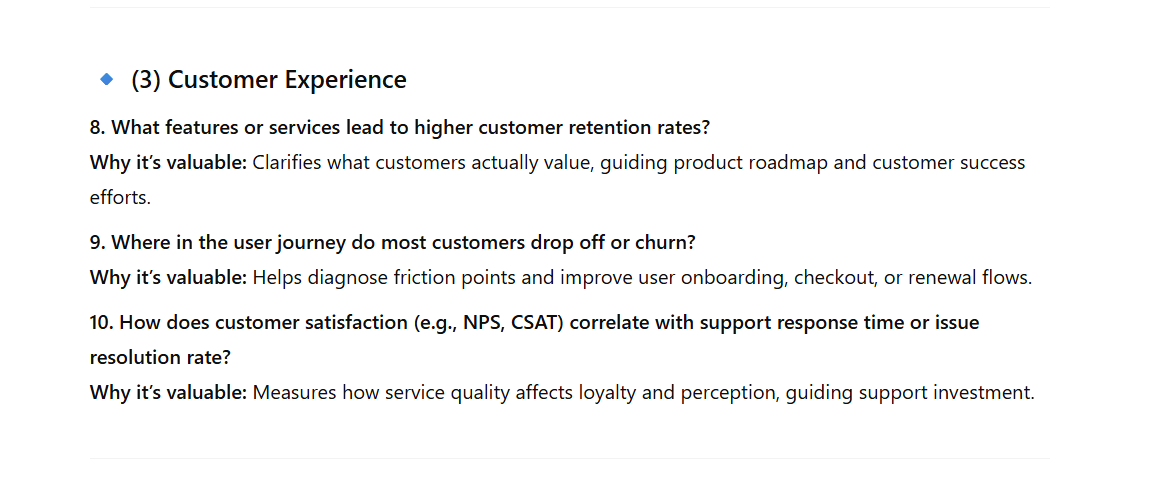
"Act as a senior business analyst. Based on the data analysis above, propose 10 insightful business questions we can answer with this dataset. For each question, categorize it into one of the following groups: (1) Growth & Revenue, (2) Operational Efficiency, (3) Customer Experience. Finally, briefly explain why each question is valuable to the business."High-quality questions might include:
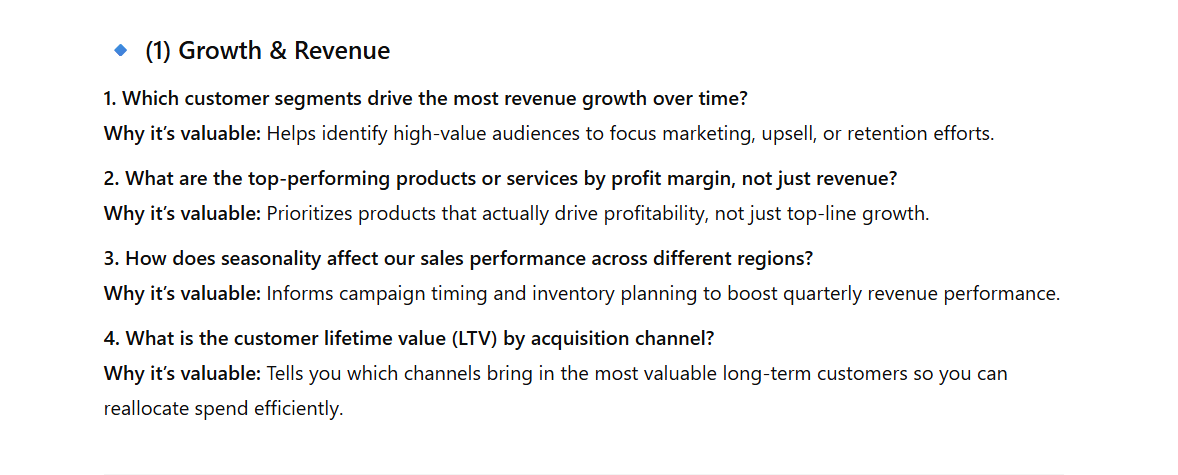
(Growth & Revenue) "Which products have the strongest correlation between high ratings and repeat purchases?" (Value: Helps identify 'star' products to amplify in marketing).
(Operational Efficiency) "What is the average time from receiving negative feedback to a related product update?" (Value: Assesses the responsiveness of the development team).
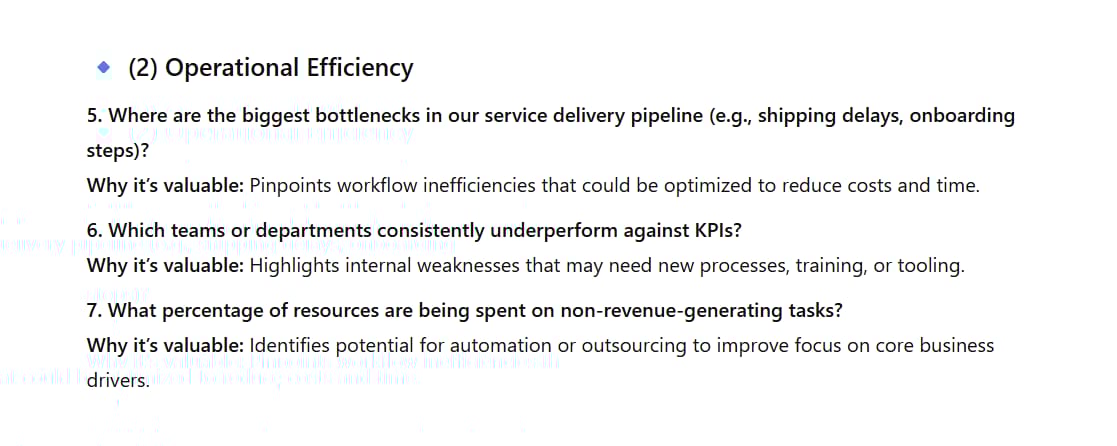
(Customer Experience) "What are the main themes mentioned in feedback with 1-2 star ratings, and how have they changed quarter-over-quarter?" (Value: Identifies the most pressing issues to prioritize solving).
Prompt 2: Verify Analytical Feasibility
Next, check for practicality:
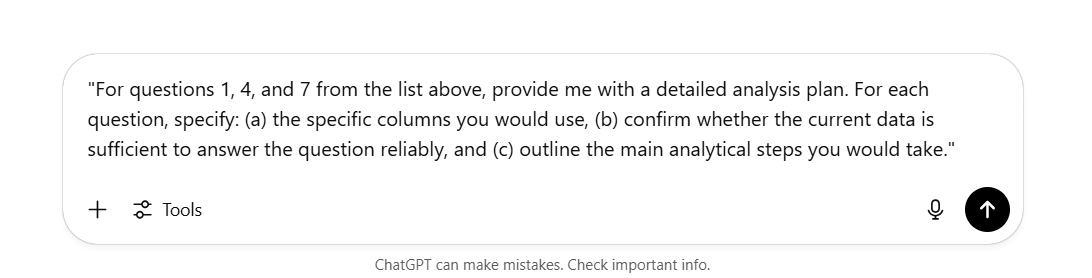
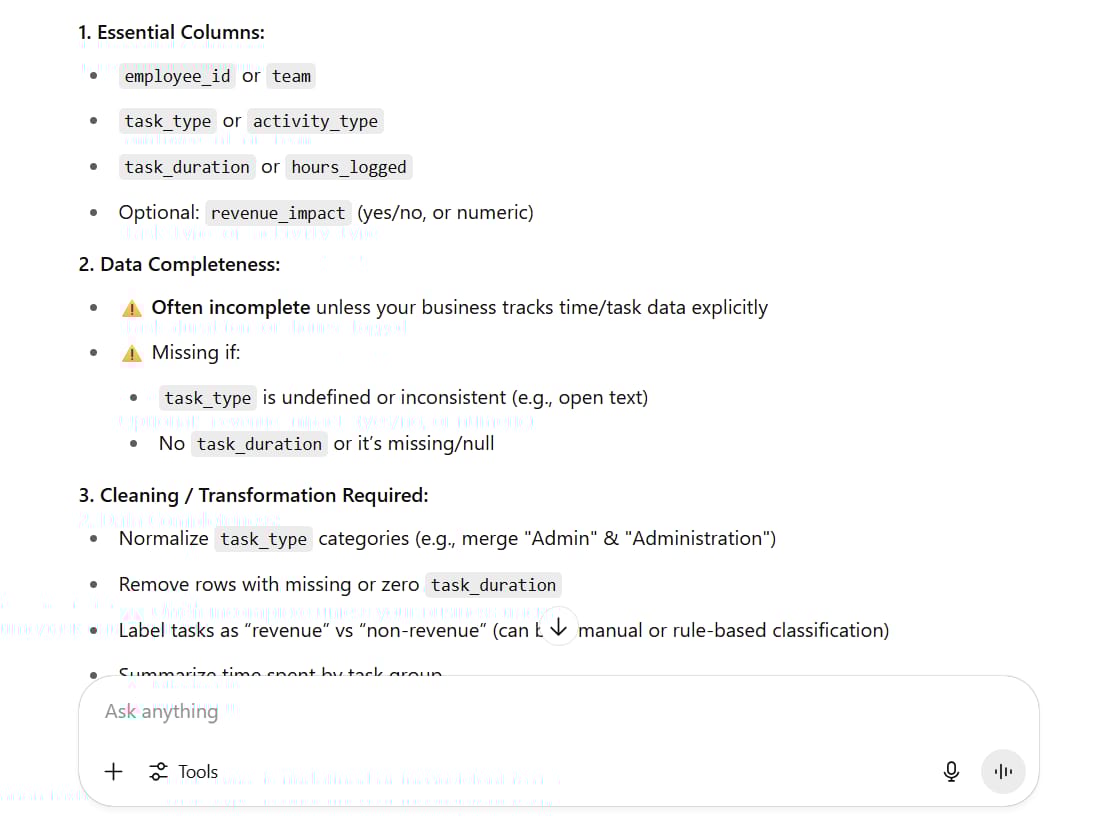
"For questions 1, 4, and 7 from the list above, provide me with a detailed analysis plan. For each question, specify: (a) the specific columns you would use, (b) confirm whether the current data is sufficient to answer the question reliably, and (c) outline the main analytical steps you would take."This forces ChatGPT to "show its work." You will learn:
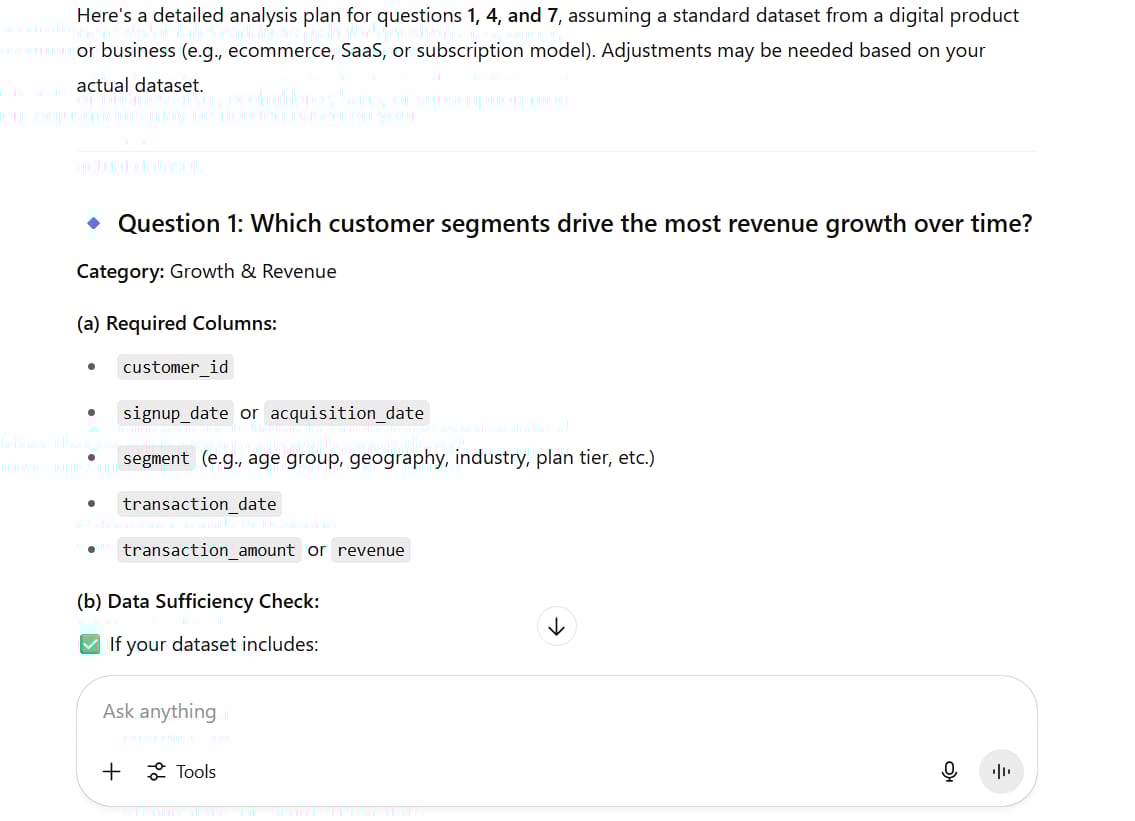
Which columns are essential for each analysis.
Whether your data is complete enough to answer the question.
What data cleaning or transformation might be necessary.
For example, ChatGPT might tell you that to analyze the correlation, you need the 'Rating' and 'Repeat Purchase Count' columns, and that the 'Rating' column needs to be cleaned to remove "N/A" values before proceeding.
Prompt 3: Identify Limitations And "Blind Spots"
This is a personal favorite prompt because it helps manage expectations and guides future data collection strategy:
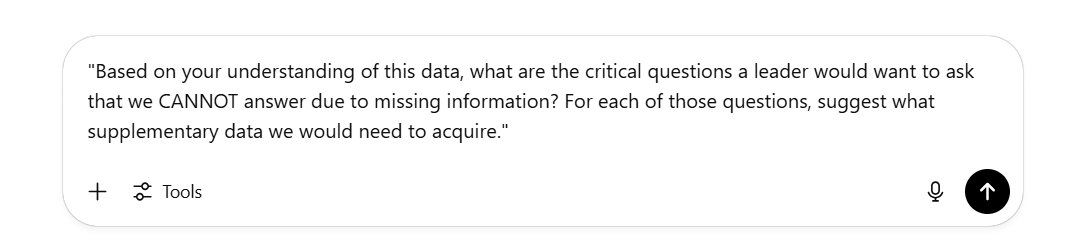
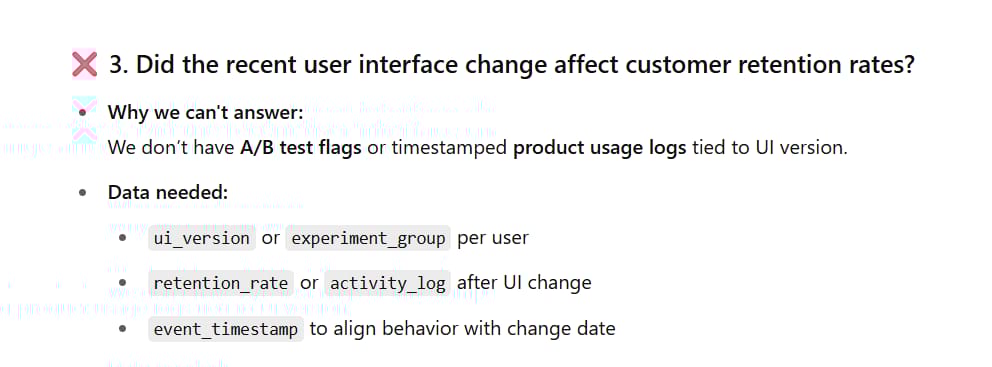
"Based on your understanding of this data, what are the critical questions a leader would want to ask that we CANNOT answer due to missing information? For each of those questions, suggest what supplementary data we would need to acquire."This prompt helps you recognize your limitations:
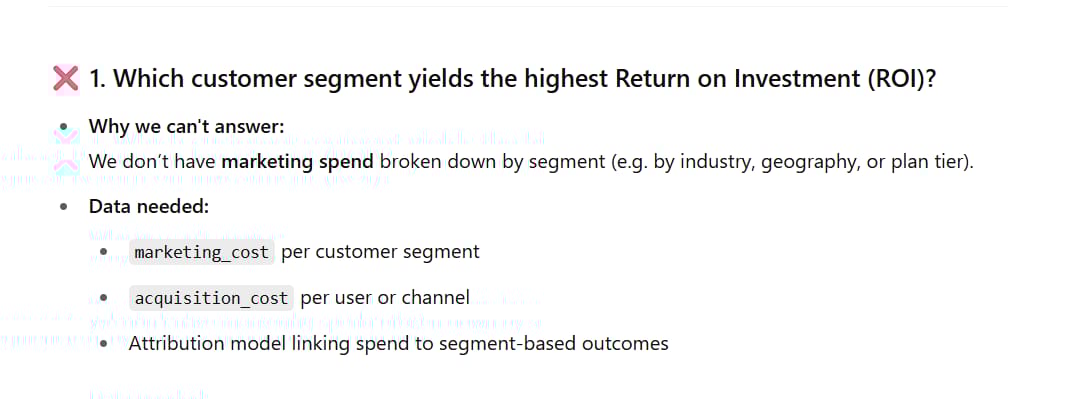
"Which customer segment yields the highest Return on Investment (ROI)?" (Need data on marketing costs per segment).
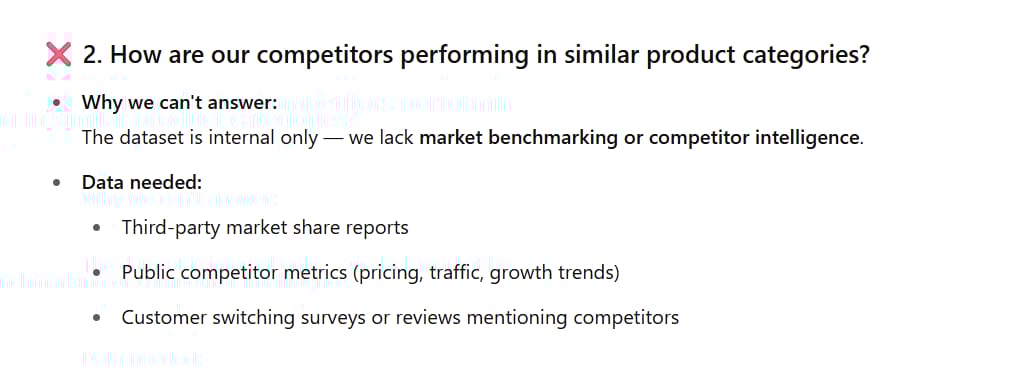
"How are our competitors performing in similar product categories?" (Need market and competitor data).
"Did the recent user interface change affect customer retention rates?" (Need A/B testing data or more detailed product usage data).
Bonus: Working With Multiple Data Sources
If you have additional data files, you can upload them to the same chat session. For example, if you had a second file with customer demographic information, you could ask:
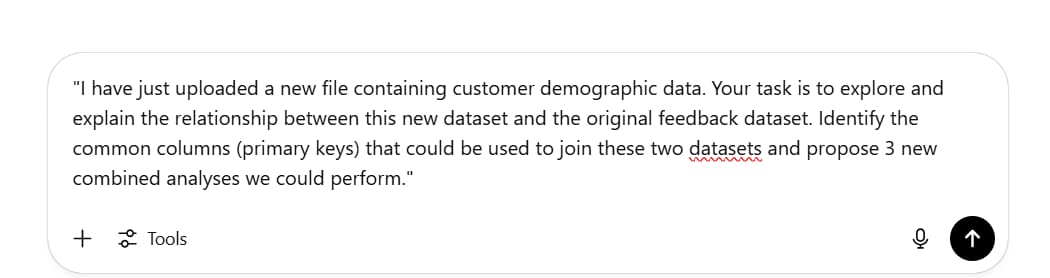
"I have just uploaded a new file containing customer demographic data. Your task is to explore and explain the relationship between this new dataset and the original feedback dataset. Identify the common columns (primary keys) that could be used to join these two datasets and propose 3 new combined analyses we could perform."ChatGPT will identify common fields (like 'Customer ID') and unlock entirely new analytical possibilities, such as "Do customers of different age groups tend to complain about different issues?"
Step 3: Goal Setting - Focusing Your Analysis
Why Goals Matter

This is the most critical step because it prevents you from creating analyses that are technically impressive but ultimately useless for the business. Too many people skip this step and end up with 20 beautiful slides that don't answer the core business question.
Goal setting helps you:
Focus on what truly matters.
Ignore irrelevant data points.
Create actionable insights.
Align your analysis with business needs.
The Context-Aware Goal-Setting Prompt
Use this detailed framework:
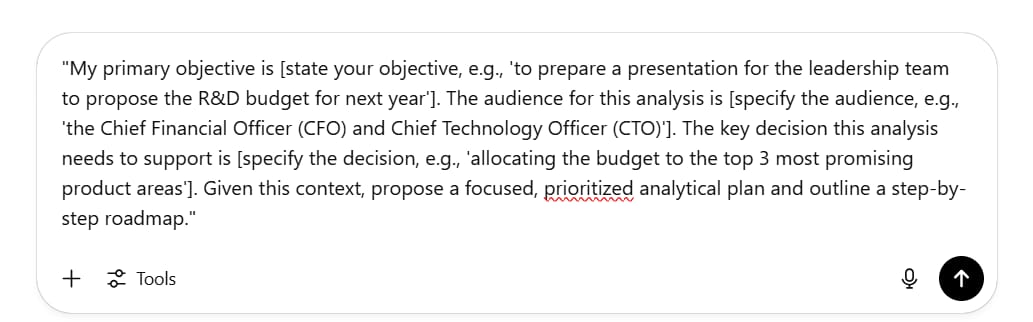
"My primary objective is [state your objective, e.g., 'to prepare a presentation for the leadership team to propose the R&D budget for next year']. The audience for this analysis is [specify the audience, e.g., 'the Chief Financial Officer (CFO) and Chief Technology Officer (CTO)']. The key decision this analysis needs to support is [specify the decision, e.g., 'allocating the budget to the top 3 most promising product areas']. Given this context, propose a focused, prioritized analytical plan and outline a step-by-step roadmap."What You'll Get Back
ChatGPT will provide:
A clear, step-by-step analytical roadmap.
Specific recommendations on data areas to focus on.
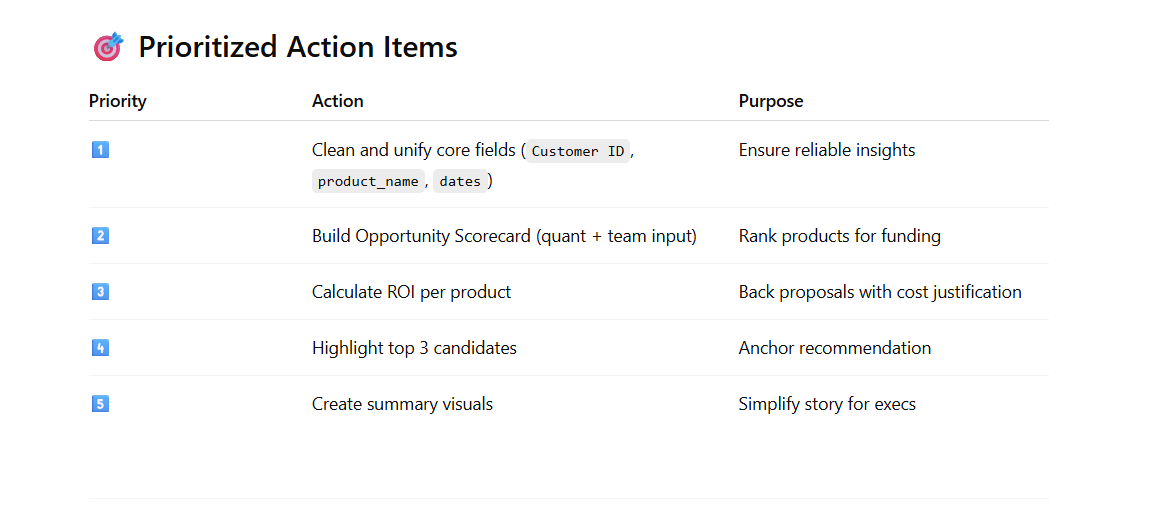
Prioritized action items.
Suggestions on how to present the data for different audiences (e.g., the CFO is interested in ROI, while the CTO is interested in technical feasibility).
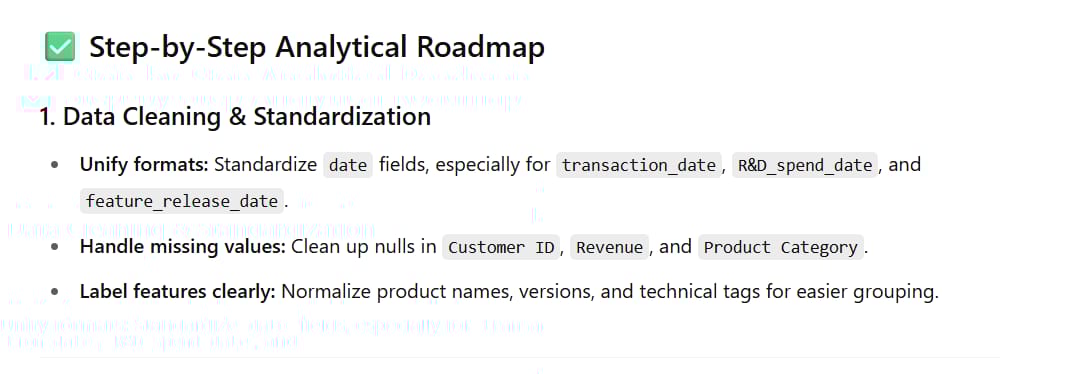
A sample roadmap might include:
Clean and Standardize: Unify date formats and handle missing values in the 'Customer ID' column.
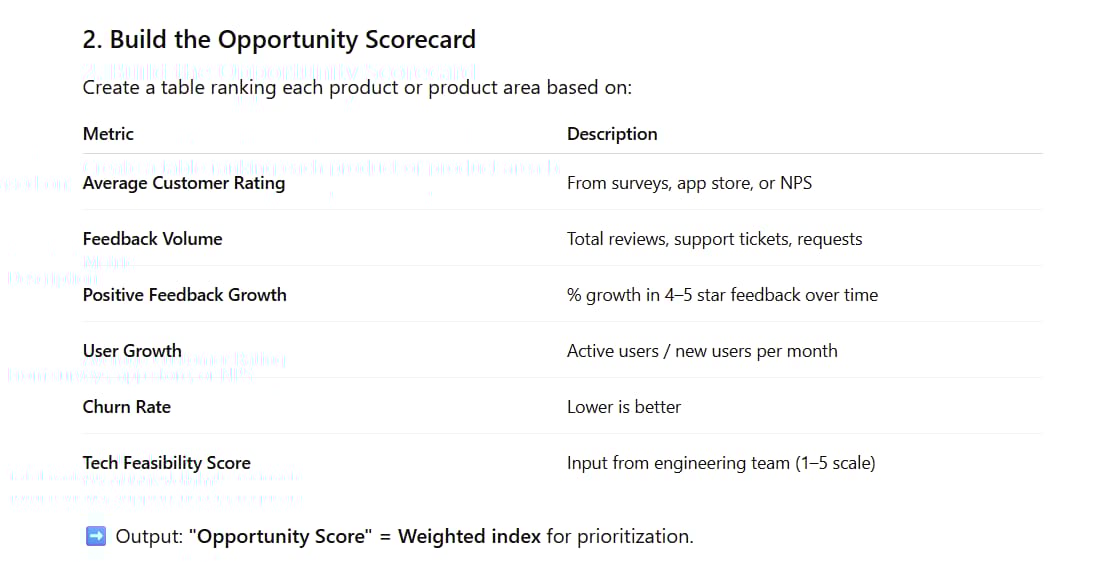
Build an "Opportunity Scorecard": Analyze product categories based on feedback volume, average rating, and growth rate of positive feedback.
Cost-Benefit Analysis (Hypothetical): Estimate the potential revenue impact if key issues were resolved.
Outlier Investigation: Investigate if any products perform counter to the general trend and why.
Real Business Insights

Following this process might uncover insights like:
"The 'Smart Home' product line receives twice as many negative feedback tickets as other lines, primarily focused on connectivity issues. However, customers who provide feedback and receive support have a 30% higher repeat purchase rate than the average. This indicates a major opportunity: improving connection stability will not only reduce support costs but could also become a significant driver of revenue growth."
This single insight could drive major investment decisions.
Advanced Techniques And Pro Tips
Choose the Right AI Model And Environment
Always use the latest and most powerful AI model available (e.g., GPT-4o in ChatGPT Plus). These models have better complex reasoning abilities, deeper contextual understanding, and make fewer errors. Among competitors, Google Gemini and Anthropic's Claude also offer powerful data analysis capabilities. Consider the data privacy policies of each platform, especially when working with sensitive information.
Create Charts And Data Visualizations
Don't just stop at text tables. Ask the AI to help you visualize the results:
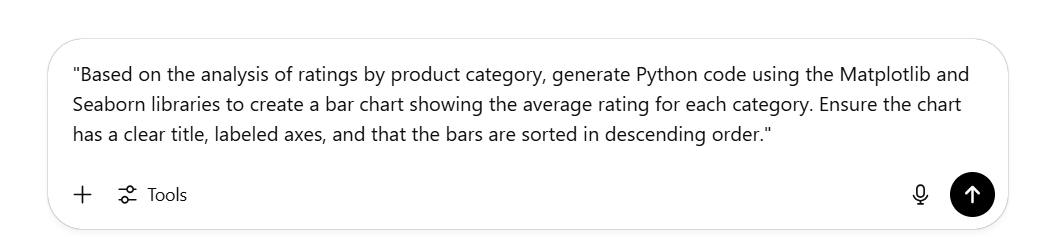
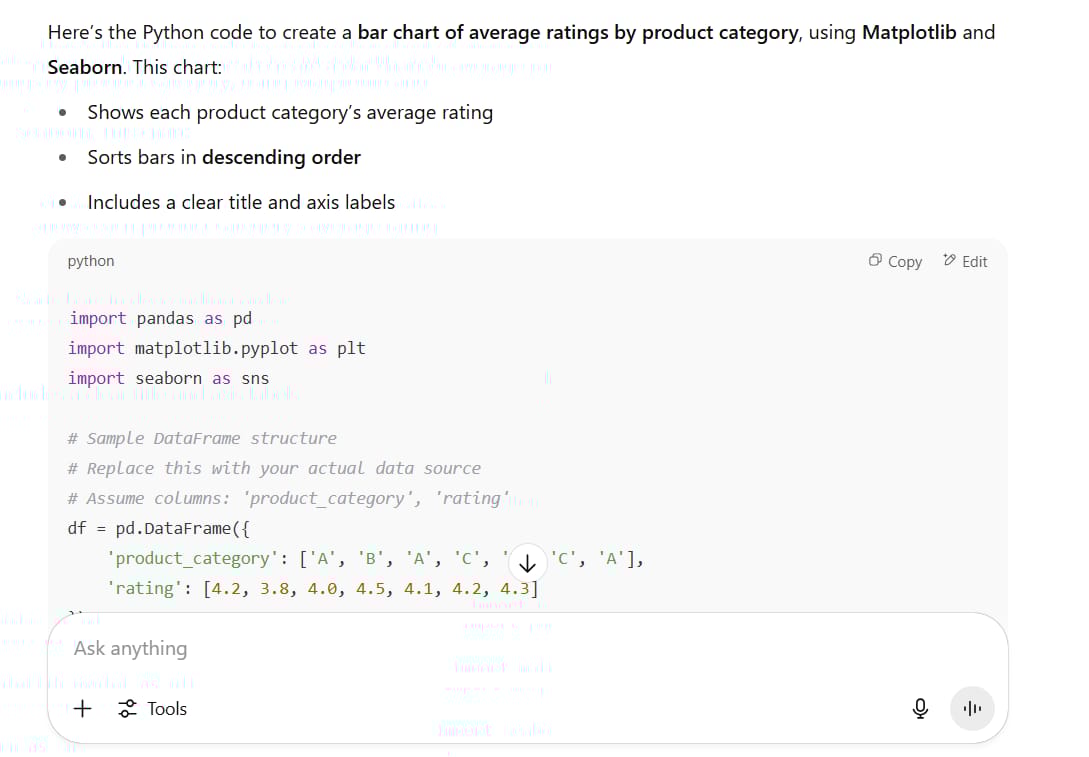
"Based on the analysis of ratings by product category, generate Python code using the Matplotlib and Seaborn libraries to create a bar chart showing the average rating for each category. Ensure the chart has a clear title, labeled axes, and that the bars are sorted in descending order."ChatGPT (with its Advanced Data Analysis capability) can execute this code and display the chart directly in the chat interface, giving you an instant visual understanding.
Handling Data Quality Issues
When ChatGPT identifies data problems, ask it for specific solutions:
"For the 9% missing values in the 'Customer ID' column, what handling method do you recommend? Should we remove these rows or use an imputation technique? Explain the pros and cons of each approach."
"Write a Python script to standardize all date formats in the 'Feedback Date' column to the 'YYYY-MM-DD' format."
Ethical Considerations And Pitfalls To Avoid
1. Data Privacy And Security

Never upload data containing Personally Identifiable Information (PII) such as names, email addresses, phone numbers, or social security numbers to public AI services. Anonymize or remove these columns before uploading. Always comply with your company's data security policies and regulations like GDPR.
2. Algorithmic Bias

Remember that AI is trained on vast amounts of internet data and can carry inherent biases. For example, when asked to suggest "interesting questions," it might prioritize types of analysis it has seen more frequently in its training data. Always use your critical thinking to evaluate the AI's suggestions. Ask yourself: "What perspective might be missing here?"
3. "Hallucination" Phenomenon

Sometimes, AI models can "make up" information with confidence. This is why verification steps like "Prompt 2: Verify Analytical Feasibility" are so important. Always ask the AI to "show its work" and cross-reference critical findings with the original data.
4. Forgetting To Prepare For Counter-Questions
Before presenting your analysis, take one final defensive step:
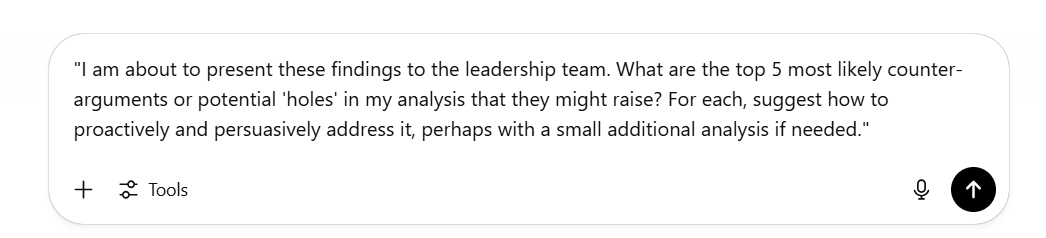
"I am about to present these findings to the leadership team. What are the top 5 most likely counter-arguments or potential 'holes' in my analysis that they might raise? For each, suggest how to proactively and persuasively address it, perhaps with a small additional analysis if needed."This step helps you anticipate the "But what about..." questions, making you more confident and well-prepared in high-stakes presentations.
Building Your Data Analysis Workflow
Data Preparation:
Anonymize sensitive data.
Upload your dataset to ChatGPT or your chosen AI platform.
Select the most advanced language model.
Execute the DIG Framework:
Run the Step 1 (Description) prompts to fully understand the data.
Work through the Step 2 (Introspection) prompts to generate hypotheses.
Use the Step 3 (Goal Setting) prompt to focus on the business objective.
In-Depth Analysis and Visualization:

Follow the roadmap proposed by the AI.
Ask the AI to generate code to visualize key findings.
Continuously ask follow-up questions as you discover interesting patterns.
Synthesize and Prepare for Presentation:

Document the most critical insights.
Use the "anticipate counter-questions" prompt.
Build a coherent narrative from the data that leads to clear, actionable recommendations.
Conclusion
The DIG framework, combined with the power of AI models like ChatGPT, is leveling the playing field for data analysis. You don't need years of training or expensive software - just a structured approach and the right prompts.
Remember the key principles:
Description: Thoroughly understand what you're working with.
Introspection: Let AI brainstorm and uncover perspectives you might miss.
Goal Setting: Focus your analysis on what actually matters to the business.
This isn't just about creating pretty charts - it's about turning raw data into actionable business intelligence that drives real decisions.
Start with your next dataset. Upload it, use the DIG framework, and watch as complex data becomes clear and useful in minutes instead of hours.
The best part? This is a repeatable process you can use immediately, regardless of your technical background. Your colleagues will wonder how you became a data analysis expert overnight.
Ready to transform your relationship with data? Try the DIG framework with AI on your next project. You'll be amazed at what you can discover when you have the right approach and a powerful analytical partner.
If you are interested in other topics and how AI is transforming different aspects of our lives or even in making money using AI with more detailed, step-by-step guidance, you can find our other articles here:
Master AI Marketing: Build Your 24/7 Digital Assistant Without Code!
Earn Money with MCP in n8n: A Guide to Leveraging Model Context Protocol for AI Automation*
Transform Your Product Photos with AI Marketing for Under $1!*
The AI Secret To Reports That Clients Actually Implement
*indicates a premium content, if any
How useful was this AI tool article for you? 💻Let us know how this article on AI tools helped with your work or learning. Your feedback helps us improve! |
Reply