- AI Fire
- Posts
- 🤖 AI In Trading: Your Ultimate Step-By-Step Guide (2025)
🤖 AI In Trading: Your Ultimate Step-By-Step Guide (2025)
Ready to upgrade your trading? Learn to use AI for in-depth analysis, building custom indicators, and stress-testing your strategies. Your complete guide.
Neil Phan
December 05, 2025
📊 How are you currently using AI in your trading? |
Table of Contents
The world of financial trading is in the midst of a quiet but incredibly powerful revolution. While many traders still cling to traditional analysis methods, smart money has been silently deploying Artificial Intelligence (AI) to uncover superior opportunities and make decisions with lightning speed. If you haven't integrated AI into your trading process, you're not just missing a competitive advantage - you're at risk of being left behind in an increasingly fierce game.
But here's the good news: you don't need to be a tech expert or a data scientist to get started. The AI era has democratized powerful tools that were once exclusive to billion-dollar investment funds. This guide will show you, in detailed, step-by-step fashion, how to apply AI to your trading so you can not only catch up but potentially leap ahead.
Why AI Is Changing The Trading Game
AI isn't just a new tool; it's a new lens through which to view the market. It's pushing outdated methods into the past, and only traders who adapt will survive and thrive. The tools we will discuss in this article, such as ChatGPT, Claude, and other platforms, all have free or very affordable versions, making them accessible to any serious trader.
The power of AI in trading rests on four main pillars:

Speed and Scale: AI can process and analyze a massive amount of data (price, volume, news, financial reports) in seconds - a task that would take a human hours or even days.
Absolute Objectivity: AI has no emotions. It is not influenced by greed, fear, or the psychological biases that have caused countless traders to fail. Its analysis is based purely on data and logic.
Advanced Pattern Recognition: AI can detect subtle correlations and patterns hidden deep within market data that are invisible to the naked eye.
Personalization and Automation: AI allows you to create tools, strategies, and workflows "tailor-made" for your unique trading style without needing to know how to code.
Let's dive into the practical applications that can transform the way you trade, starting today.
1. In-Depth Chart Analysis With AI - Your Personal Technical Analyst
Chart analysis is the foundation of technical trading, but it's also a realm filled with subjectivity. Your support level might be someone else's noise. AI helps eliminate this ambiguity.
The Inherent Problem With Manual Analysis:
Traders often struggle to identify key price zones consistently. They might miss hidden support/resistance levels, draw trendlines incorrectly, or get fooled by market "noise," leading to ill-informed trading decisions.
How AI Solves This:
By providing an objective perspective, AI acts as a seasoned technical analyst, scanning the chart and highlighting the most critical elements based on historical price data.
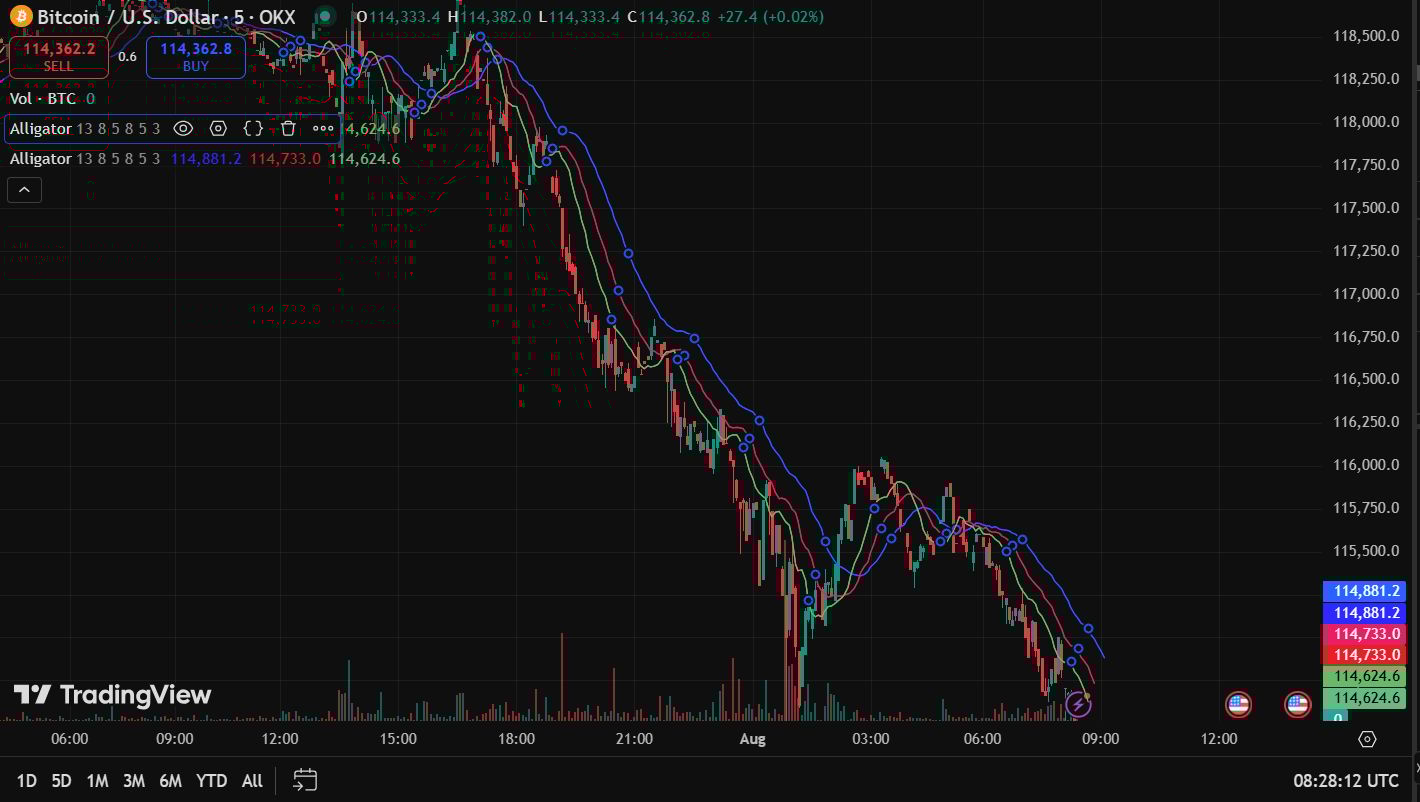
Step 1: Take A Screenshot Of The Chart
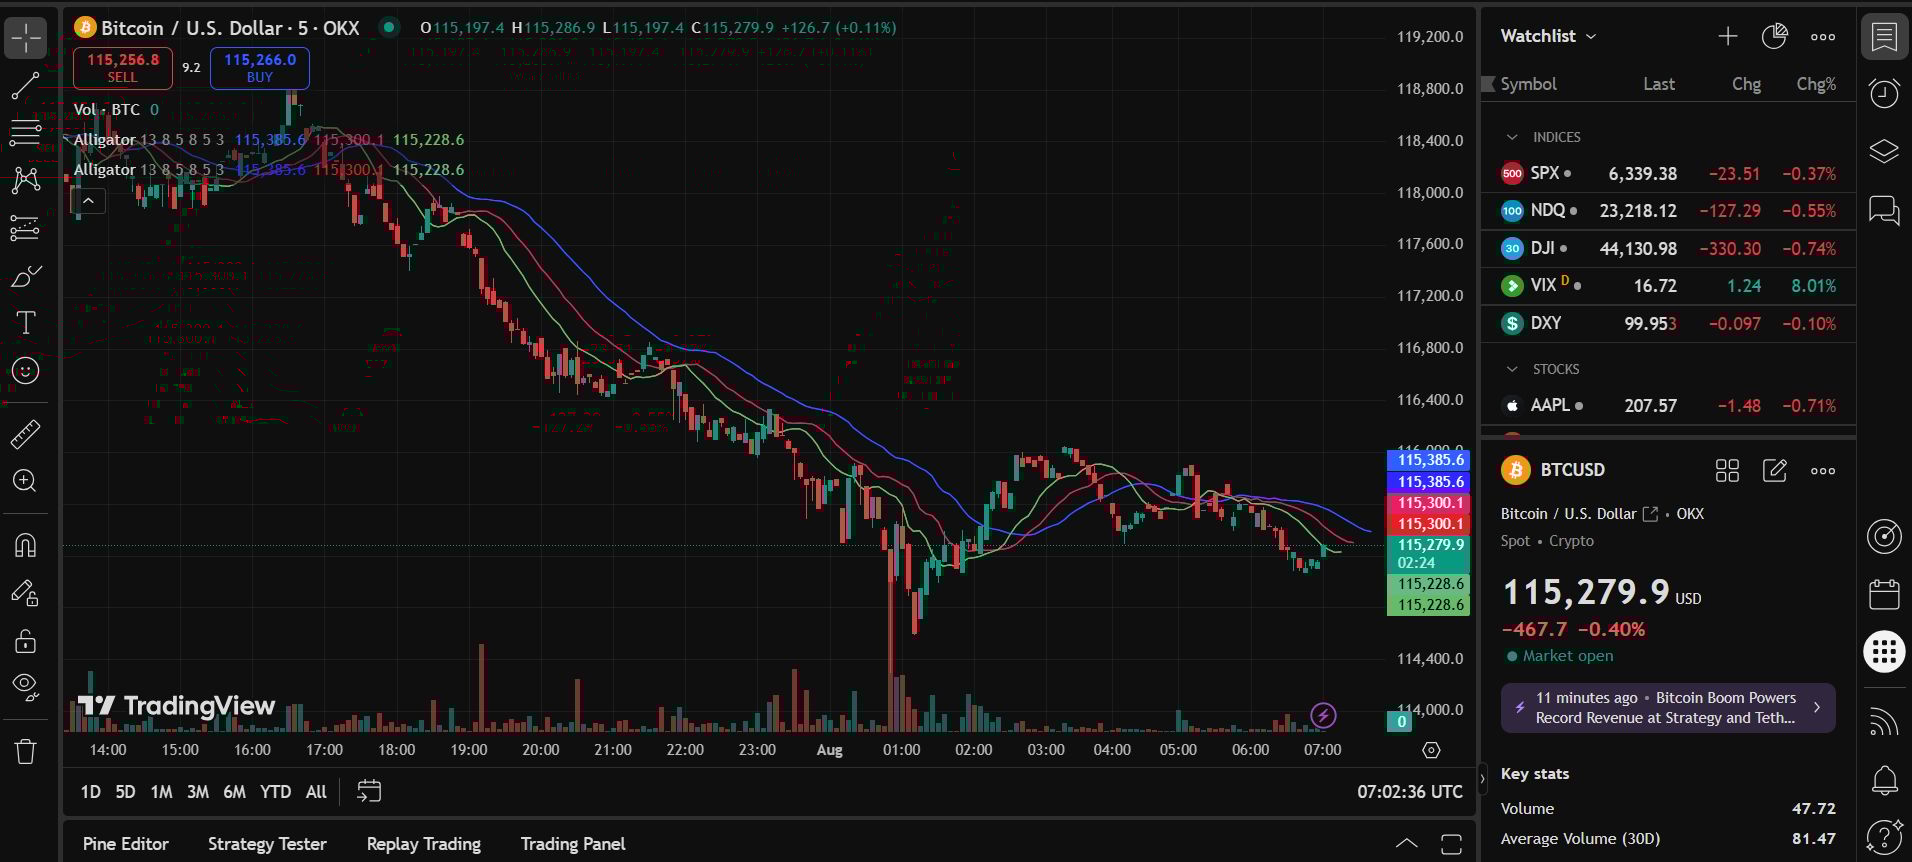
Start with a "naked" price chart (without any indicators or drawings). Take a clear screenshot. Don't worry about making it perfect; AI can work with any clear chart image.
Step 2: Upload And Ask Smart Questions
Upload the image to your chosen AI tool. Instead of a generic question, try more detailed prompts to unlock AI's full potential:
Prompt for a Trend-Following Trader:
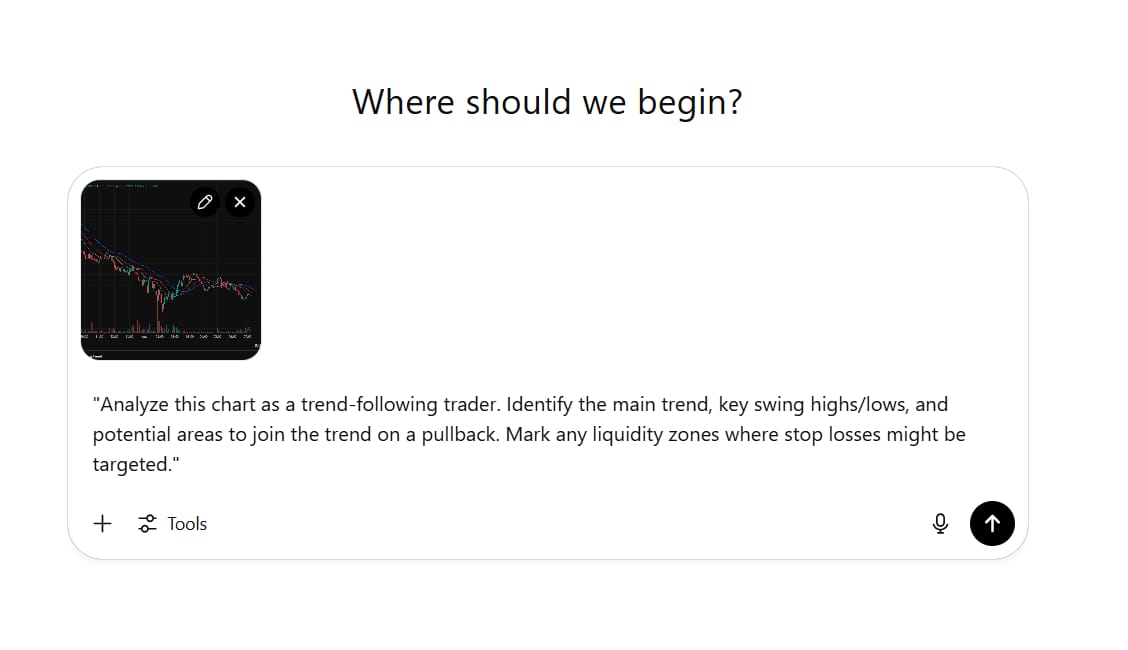
"Analyze this chart as a trend-following trader. Identify the main trend, key swing highs/lows, and potential areas to join the trend on a pullback. Mark any liquidity zones where stop losses might be targeted."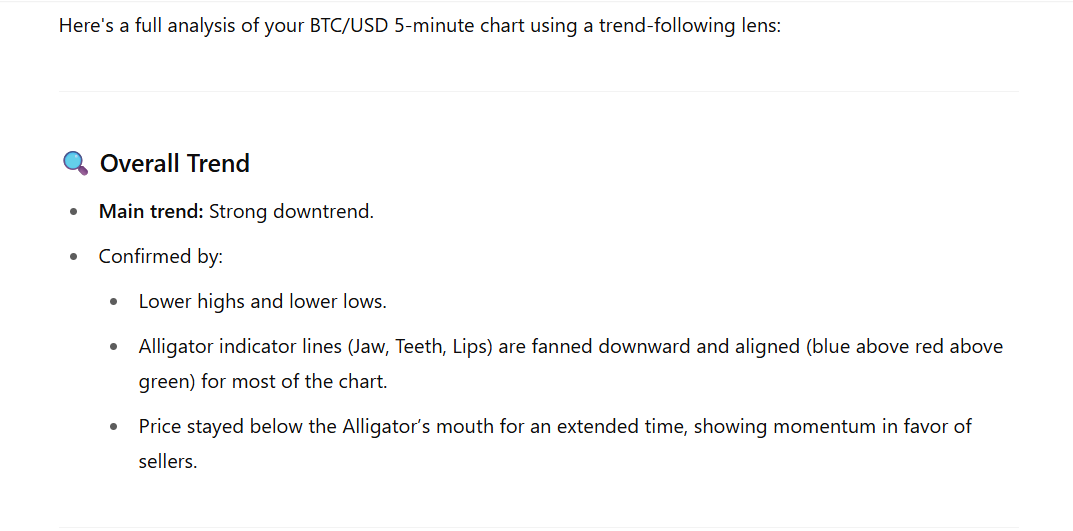
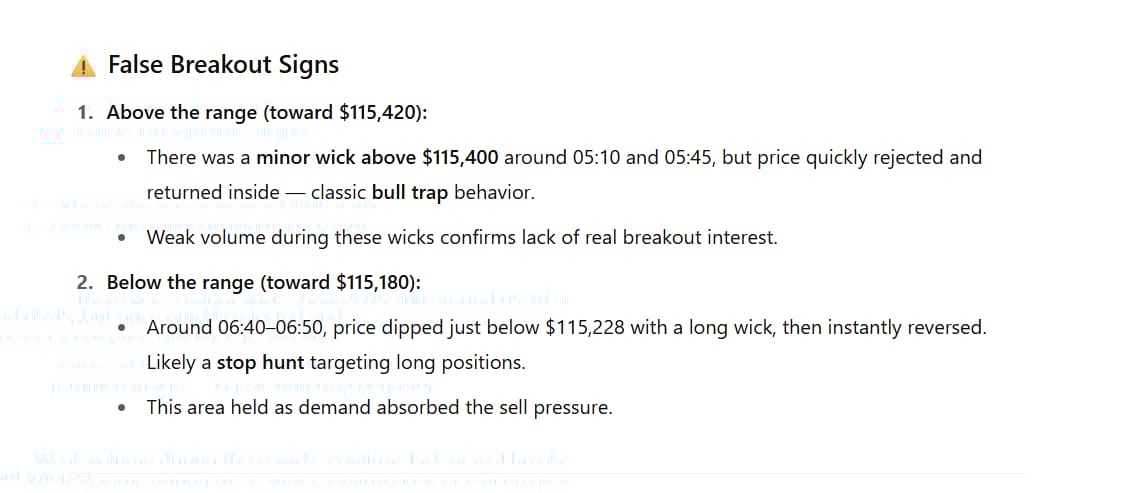
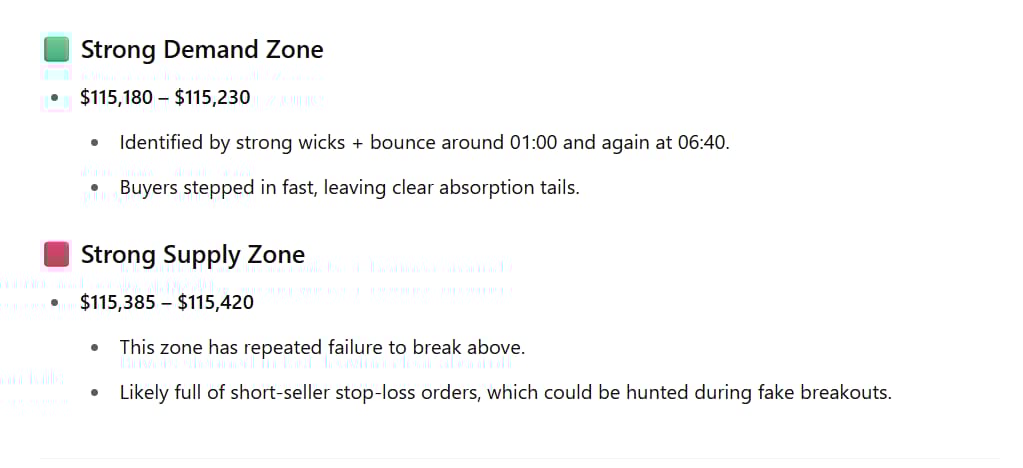
Prompt for a Range Trader:
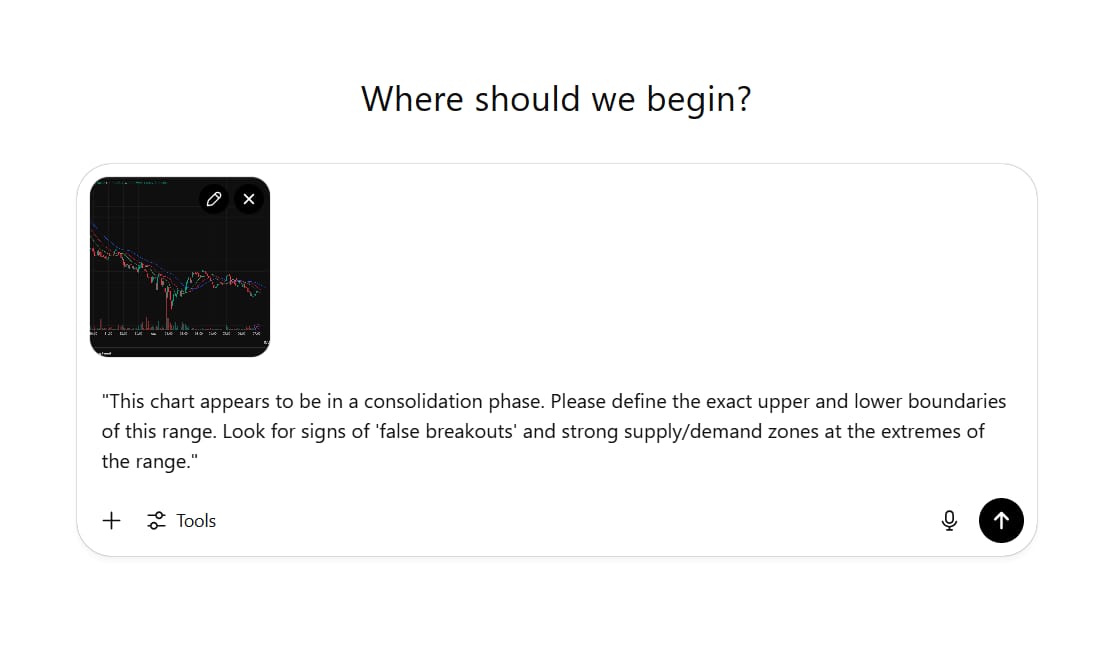
"This chart appears to be in a consolidation phase. Please define the exact upper and lower boundaries of this range. Look for signs of 'false breakouts' and strong supply/demand zones at the extremes of the range."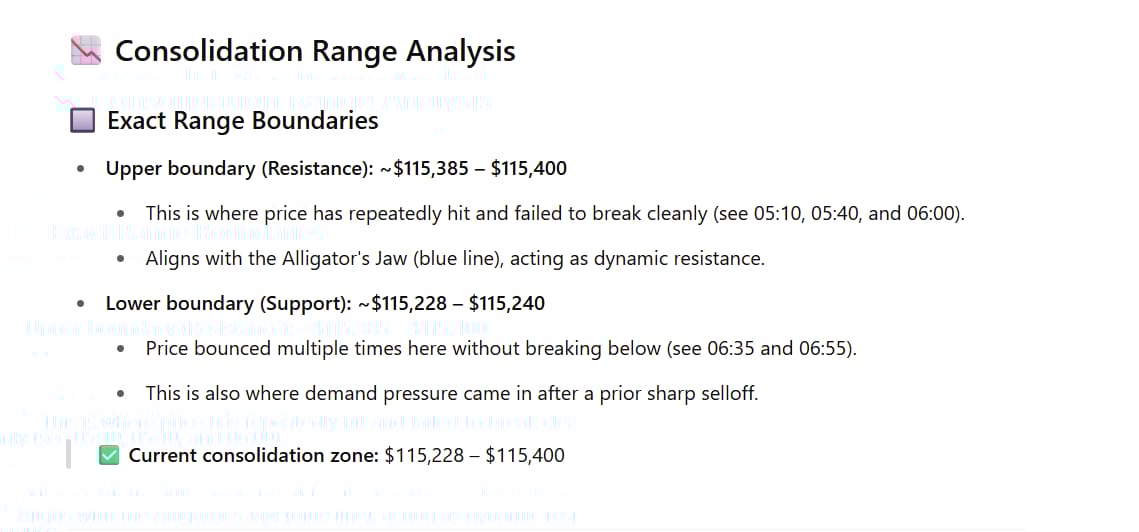
Prompt for an Expert Role-Play:
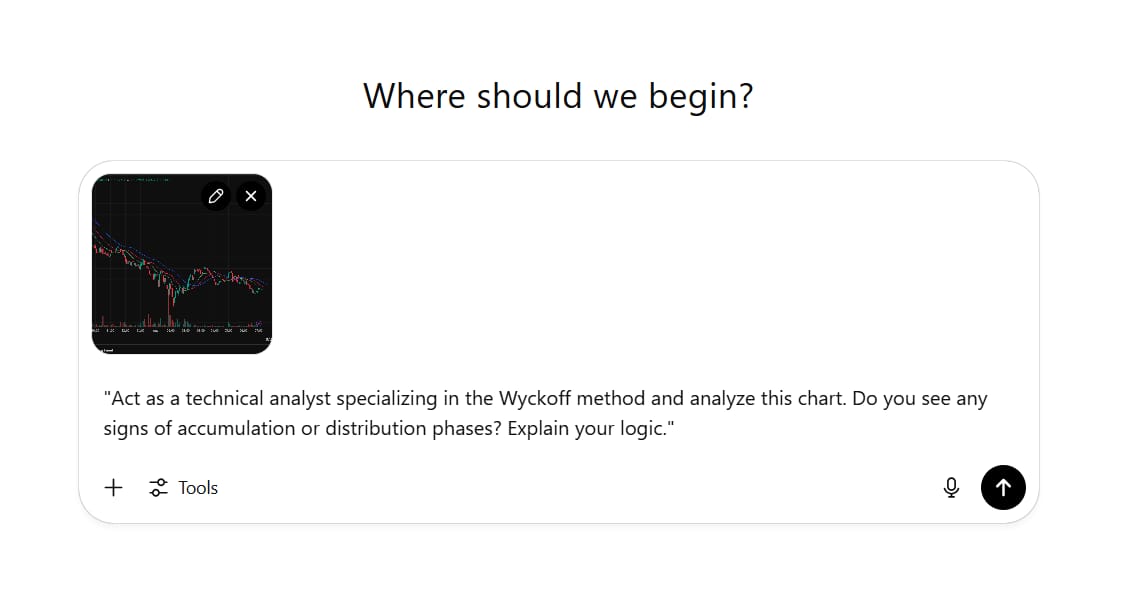
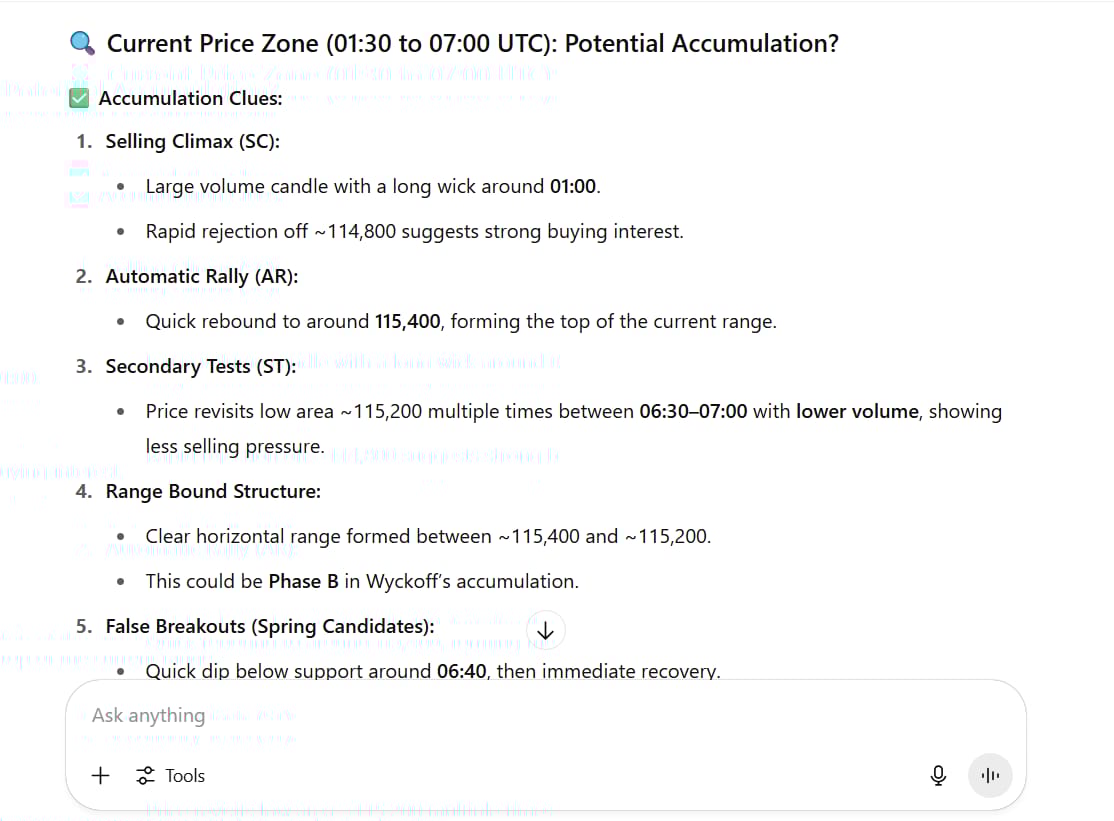
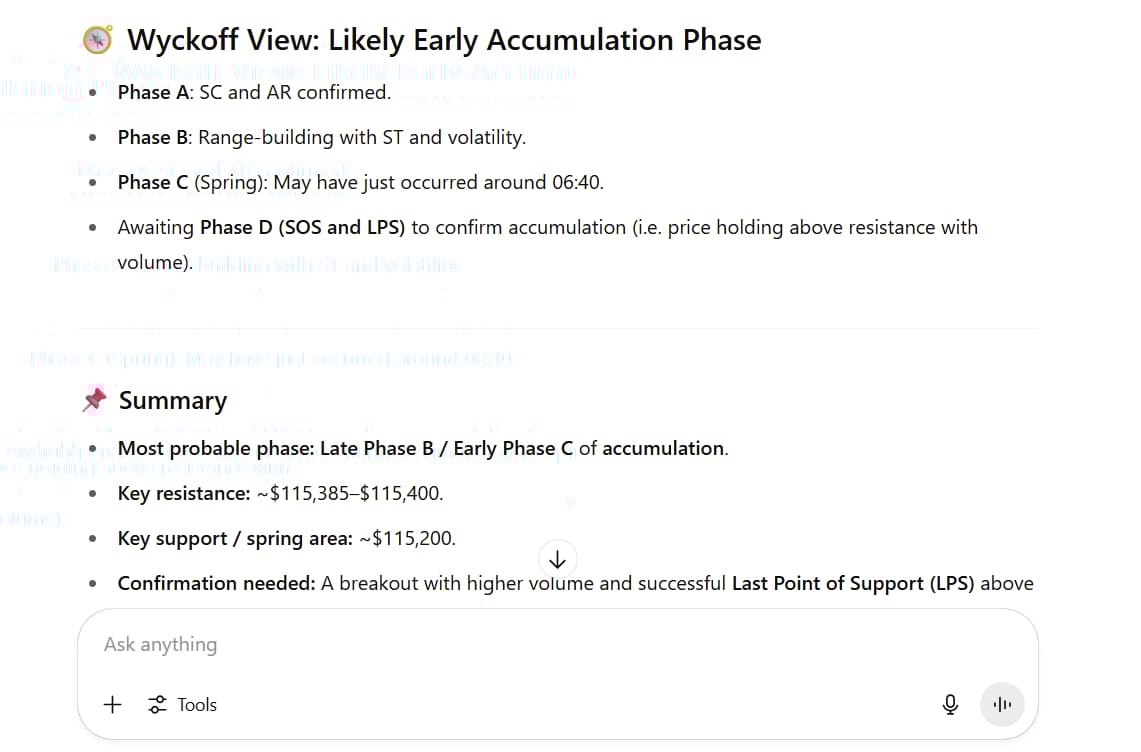
"Act as a technical analyst specializing in the Wyckoff method and analyze this chart. Do you see any signs of accumulation or distribution phases? Explain your logic."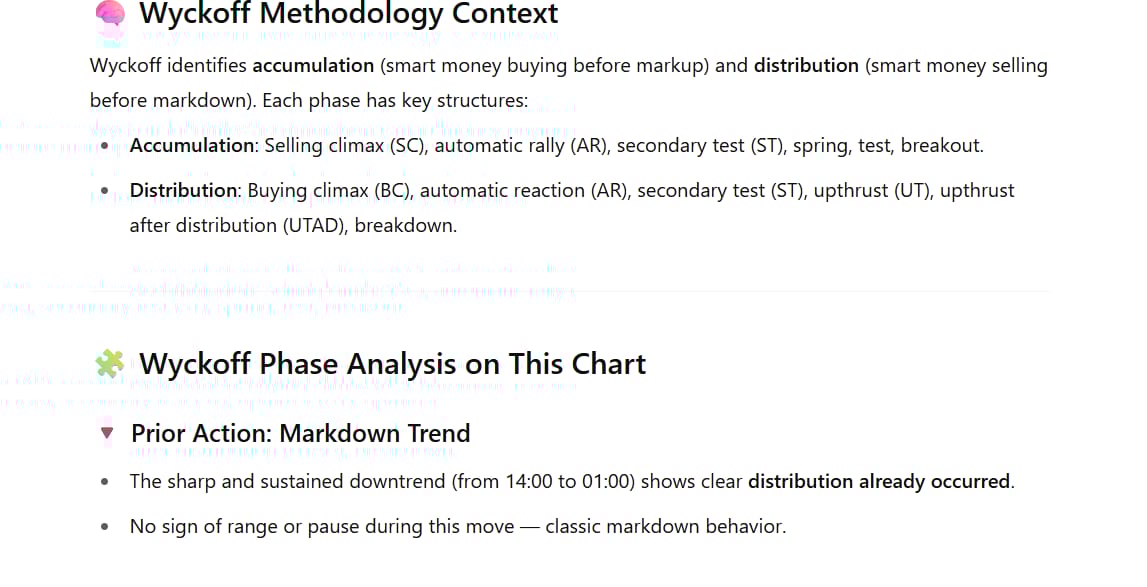
Learn How to Make AI Work For You!
Transform your AI skills with the AI Fire Academy Premium Plan - FREE for 14 days! Gain instant access to 500+ AI workflows, advanced tutorials, exclusive case studies and unbeatable discounts. No risks, cancel anytime.
Step 3: Review And Interpret The AI's Analysis
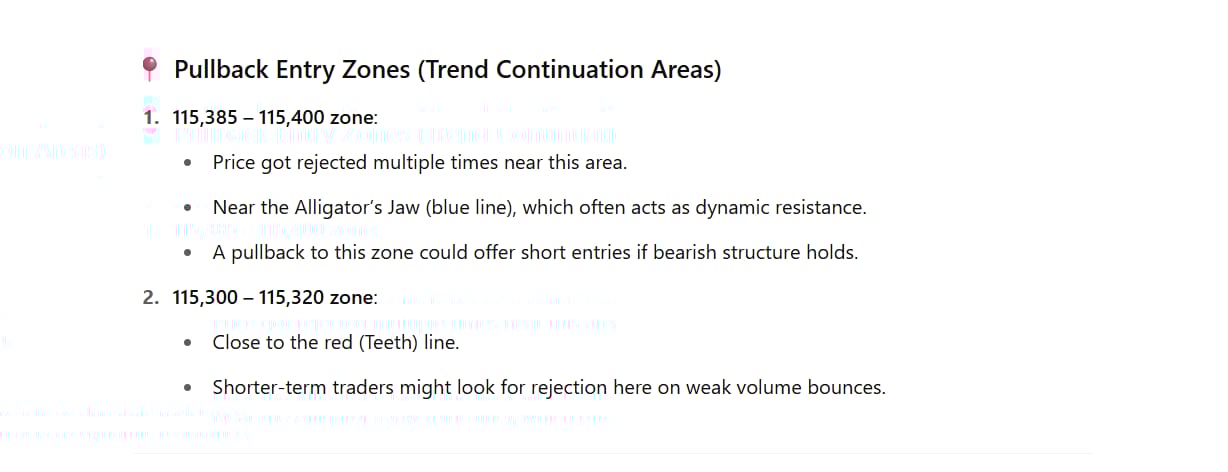
The AI will return a detailed analysis, often including:
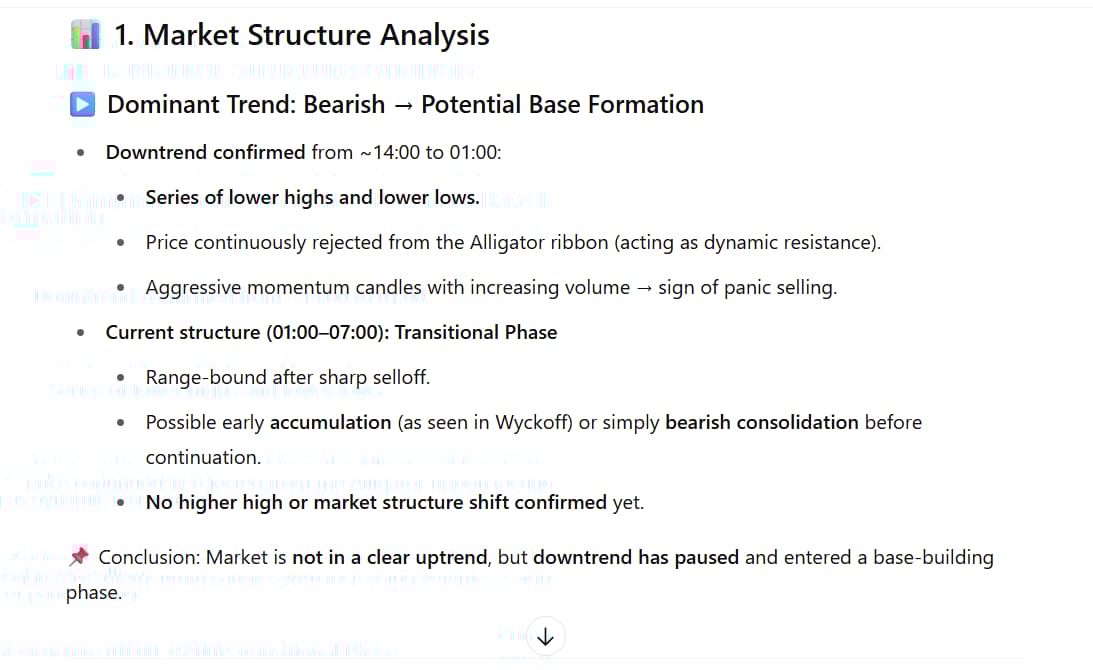
Market Structure: It will point out the dominant trend (uptrend, downtrend, or sideways) with specific evidence like a series of higher highs and higher lows.
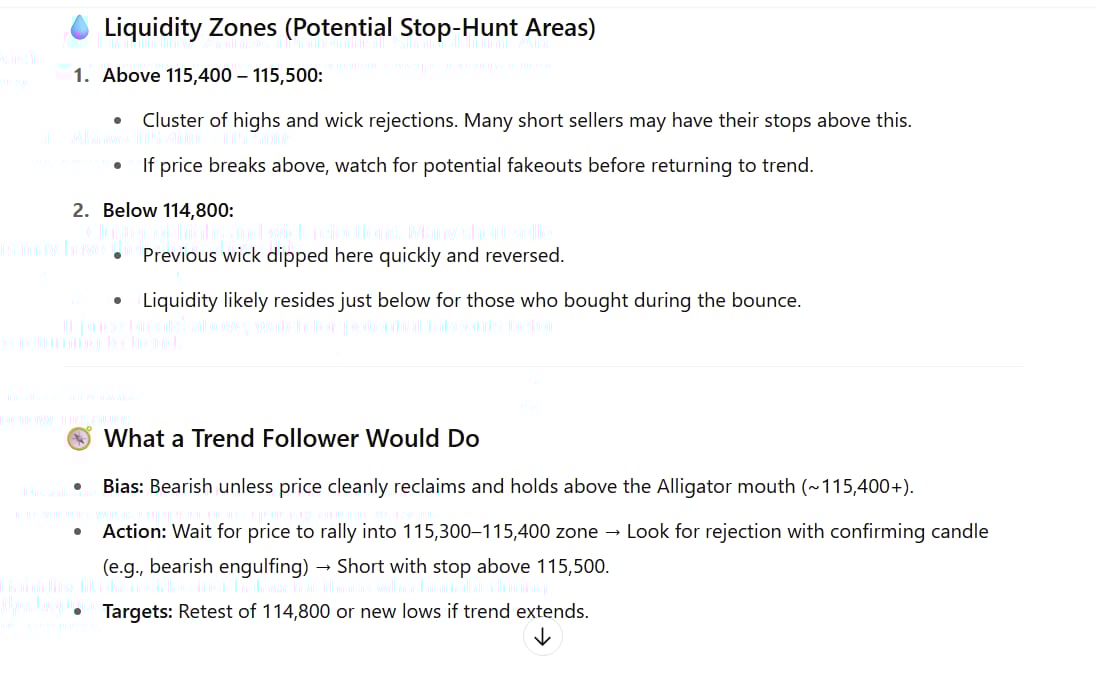
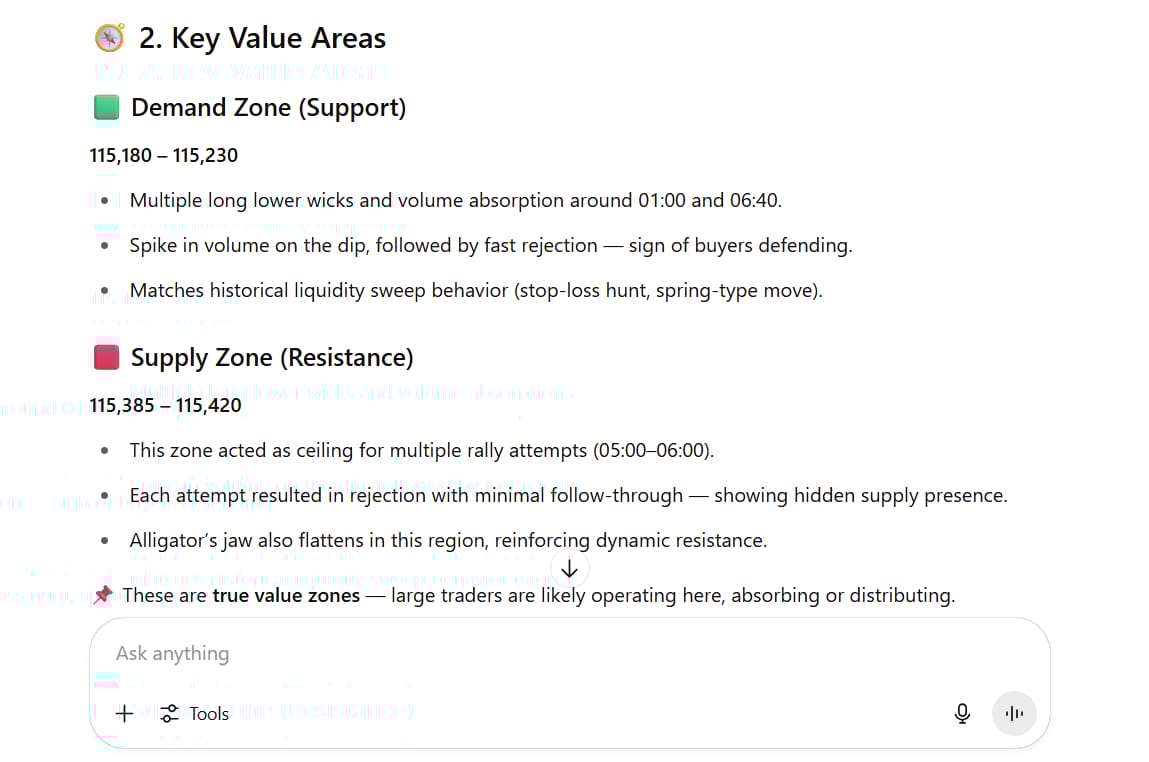
Key Value Areas: Precise identification of support zones (where buying pressure was strong) and resistance zones (where selling pressure was overwhelming). AI often refers to these as demand and supply zones.
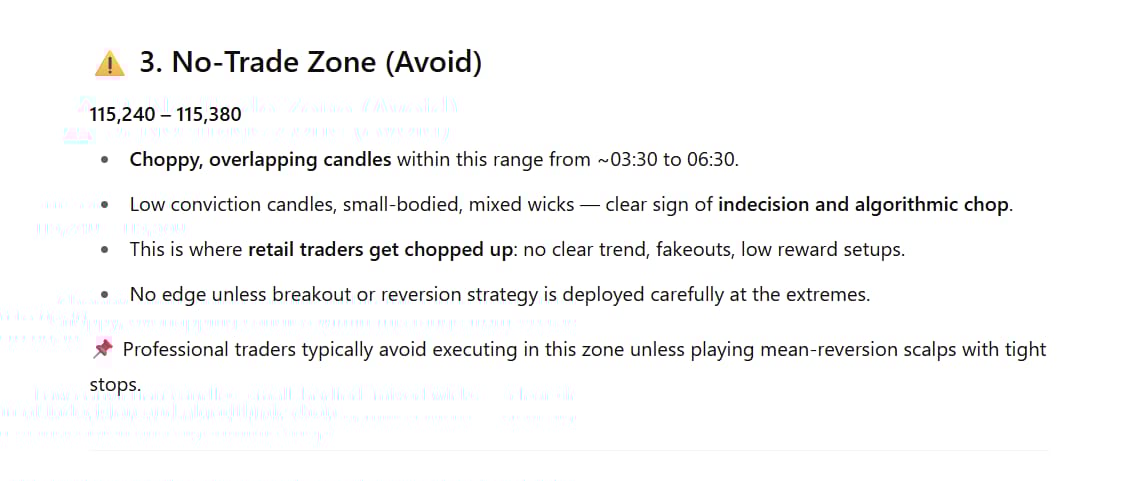
"No-Trade Zones": This is one of the most valuable pieces of information. AI will highlight the choppy, unpredictable areas between key levels where retail traders often lose money fighting the noise.
The Superior Advantage:
Instead of spending hours squinting at charts and debating a price level with yourself, you get a clear market map in minutes. You know exactly where to patiently wait for a high-quality setup and, more importantly, which areas to avoid. This saves time, mental energy, and money.
2. Multi-Time Frame Analysis With AI - Ending The Confusion
One of the biggest challenges for traders is the chaos of conflicting signals across different timeframes. The daily chart shows a strong uptrend, but the 15-minute chart is in a steep downtrend. Which one do you trust?
The Inherent Problem:

Conflicting timeframes cause "analysis paralysis." Traders don't know whether to follow the long-term trend or react to short-term momentum, leading them to miss opportunities or enter trades at the wrong time.
How AI Connects The Dots:
AI has the ability to synthesize information from multiple sources and create a single, unified "market story."
Step 1: Gather A Set Of Multi-Time Frame Screenshots
Take screenshots of the timeframes you typically use, for example: Weekly, Daily, 4-Hour (H4), and 1-Hour (H1).
Step 2: Upload Them All And Ask For A Holistic View
Feed all the images to the AI at once and use a comprehensive prompt:
Prompt For Top-Down Analysis:
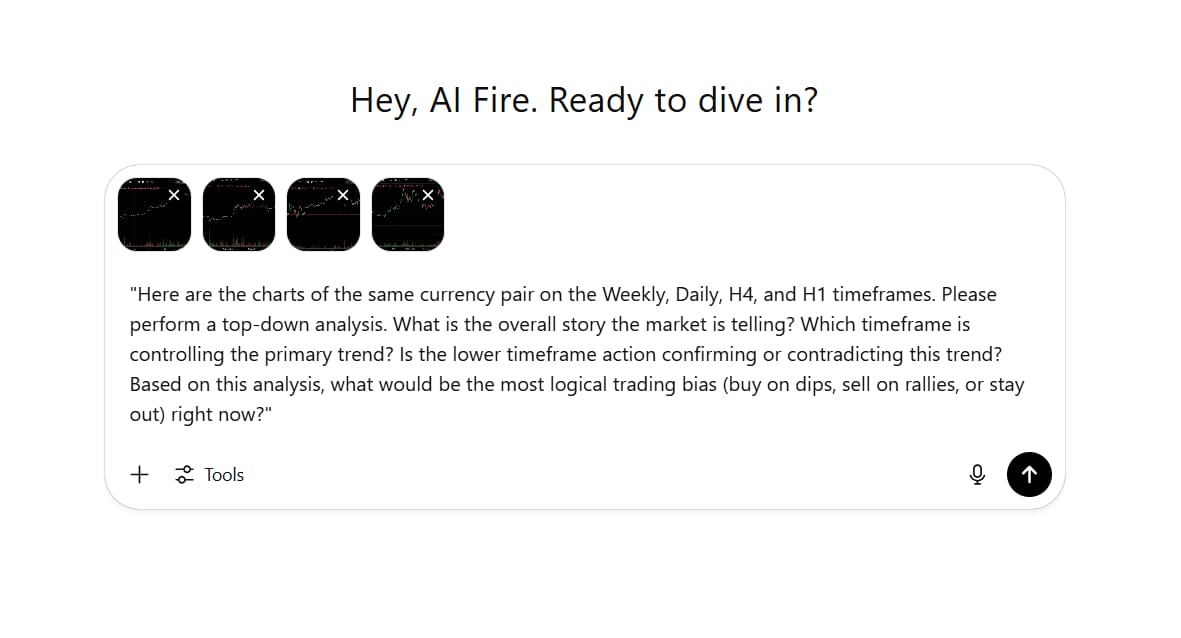
"Here are the charts of the same currency pair on the Weekly, Daily, H4, and H1 timeframes. Please perform a top-down analysis. What is the overall story the market is telling? Which timeframe is controlling the primary trend? Is the lower timeframe action confirming or contradicting this trend? Based on this analysis, what would be the most logical trading bias (buy on dips, sell on rallies, or stay out) right now?"Step 3: Receive A Unified Market Report
The AI will analyze and link the patterns:
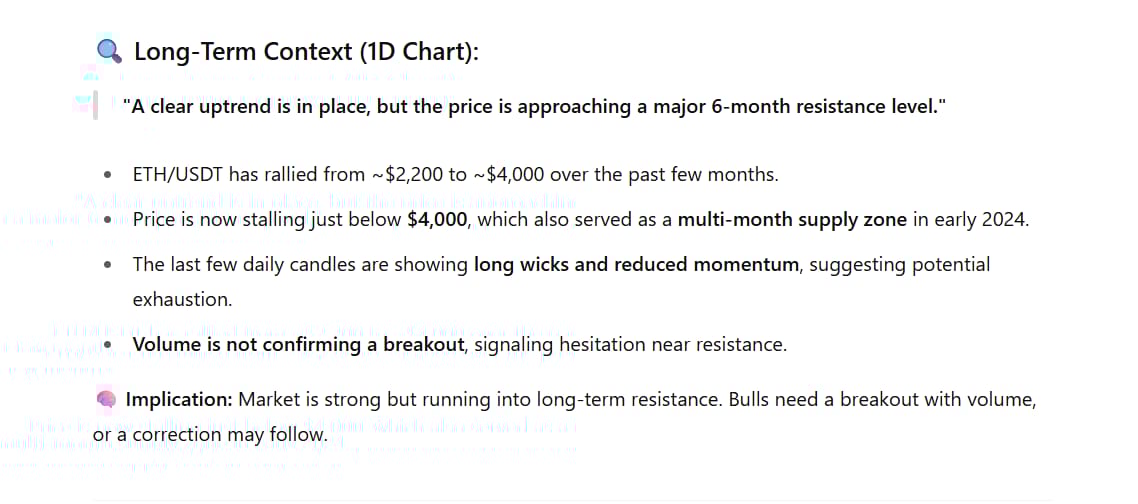
Long-Term Context (e.g., Daily): "A clear uptrend is in place, but the price is approaching a major 6-month resistance level."
Medium-Term Momentum (e.g., H4): "The upward momentum is showing signs of slowing, evidenced by smaller-bodied candles with long upper wicks, indicating indecision from buyers."

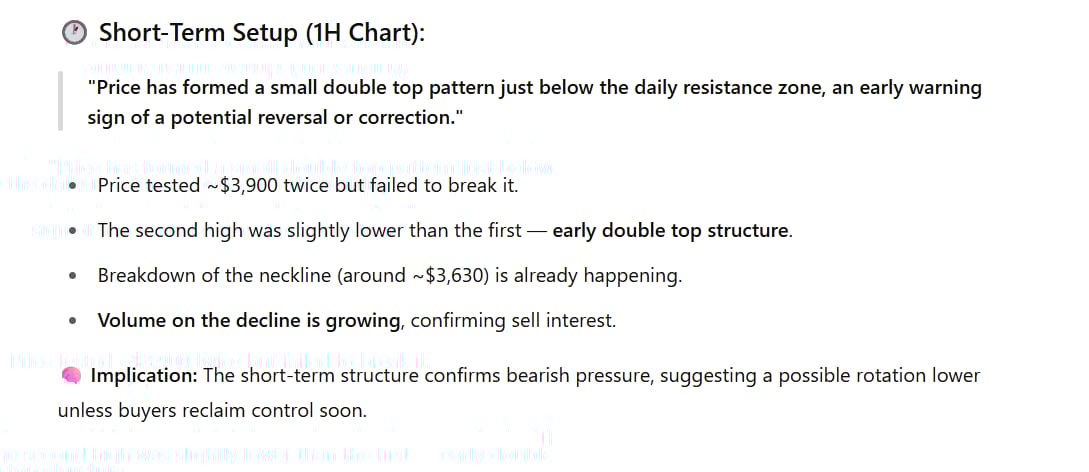
Short-Term Setup (e.g., H1): "Price has formed a small double top pattern just below the daily resistance zone, an early warning sign of a potential reversal or correction."
The AI's Consolidated Recommendation:
Based on the analysis above, the AI might conclude: "All time frames suggest that the long-term uptrend is facing a significant hurdle. While the primary trend is still up, the risk of buying at the current price is very high. Traders should consider taking profits on long positions or look for short-term sell signals on the H1 timeframe if the price confirms a breakdown of the double top pattern."
This approach transforms chaos into clarity, giving you a single, actionable plan that accounts for both the macro context and the micro dynamics.
3. Create Exclusive Technical Indicators With AI - No Coding Required
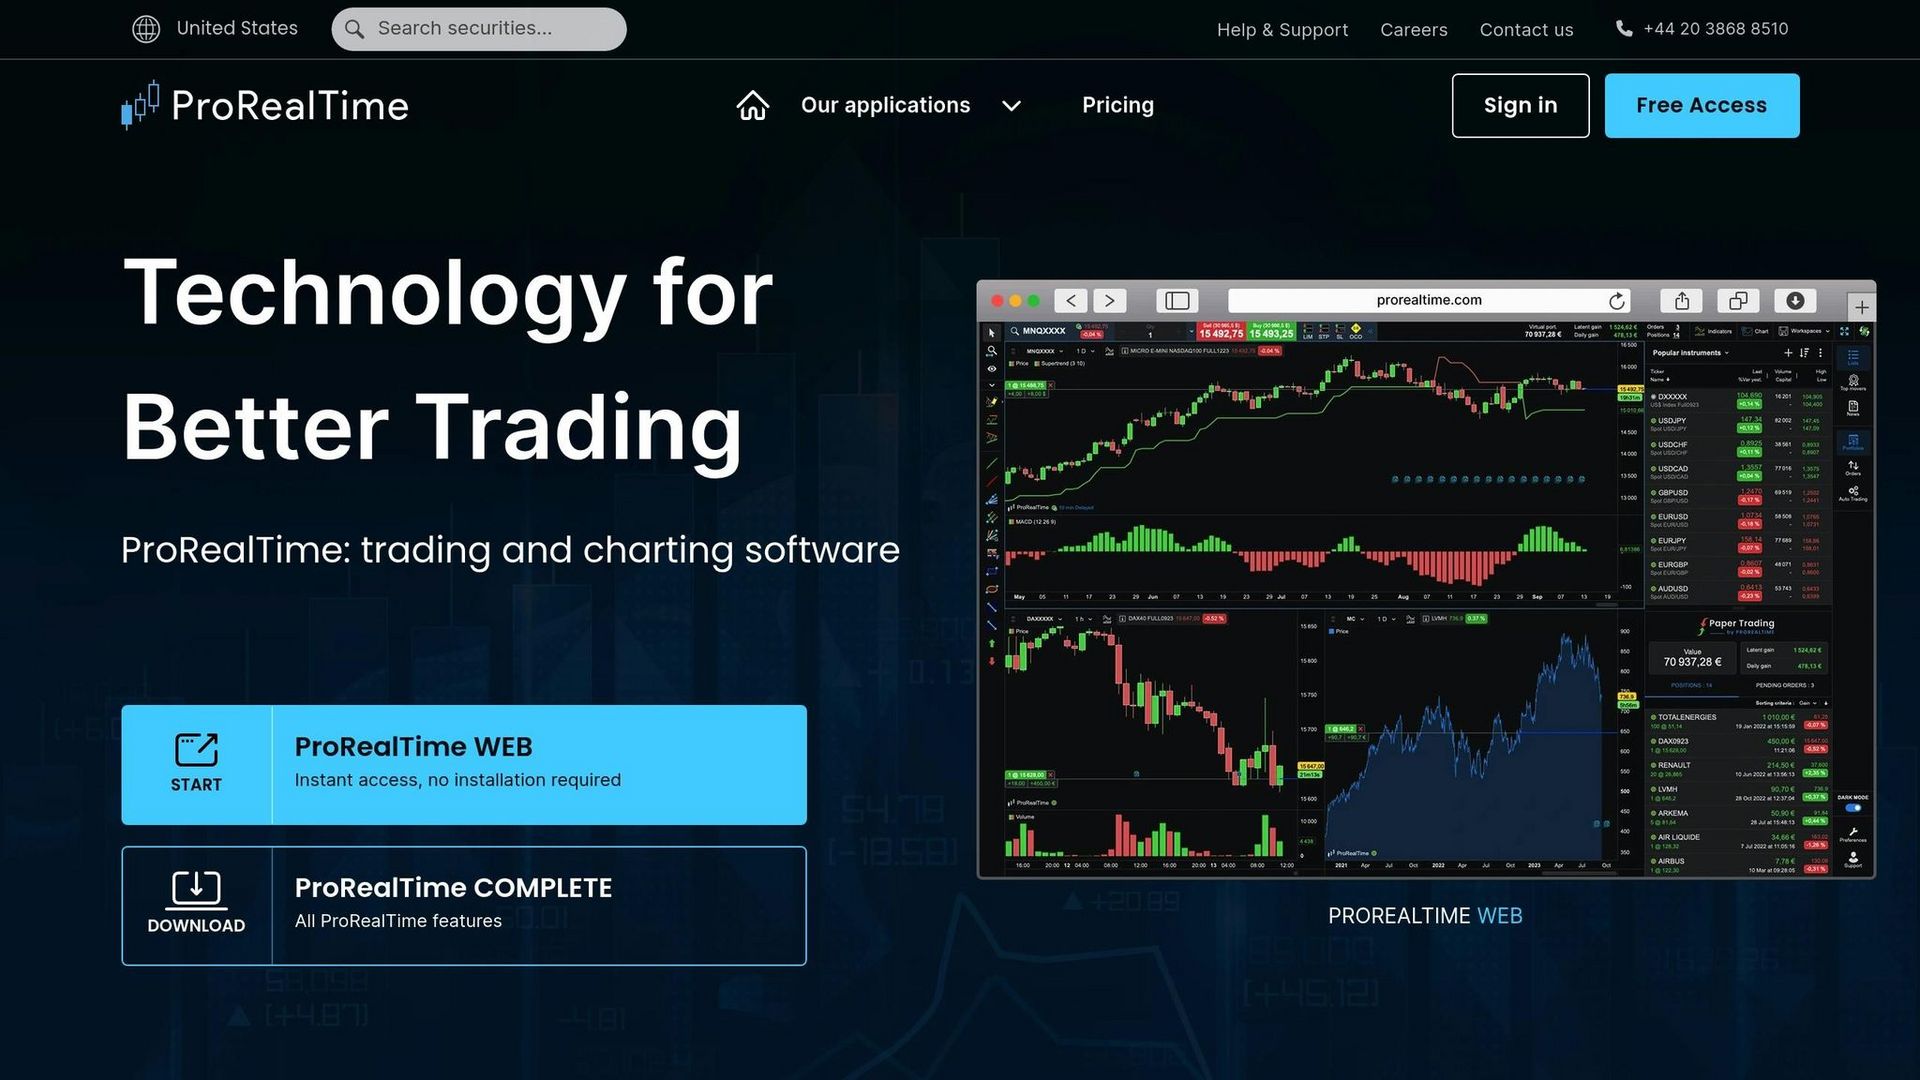
Do you have dozens of ideas for unique trading indicators but are held back by the barrier of learning Pine Script for TradingView? AI is the bridge between your idea and its implementation.
The Inherent Problem:
Creating a custom indicator requires programming knowledge or the often high cost of hiring a developer. This leaves many of a trader's most creative ideas unrealized.
AI As Your Personal Programmer:
You simply describe your idea in plain language, and the AI will translate it into source code.
Step 1: Describe Your Idea In Detail
Clarity is key. Be very specific about what you want your indicator to do.
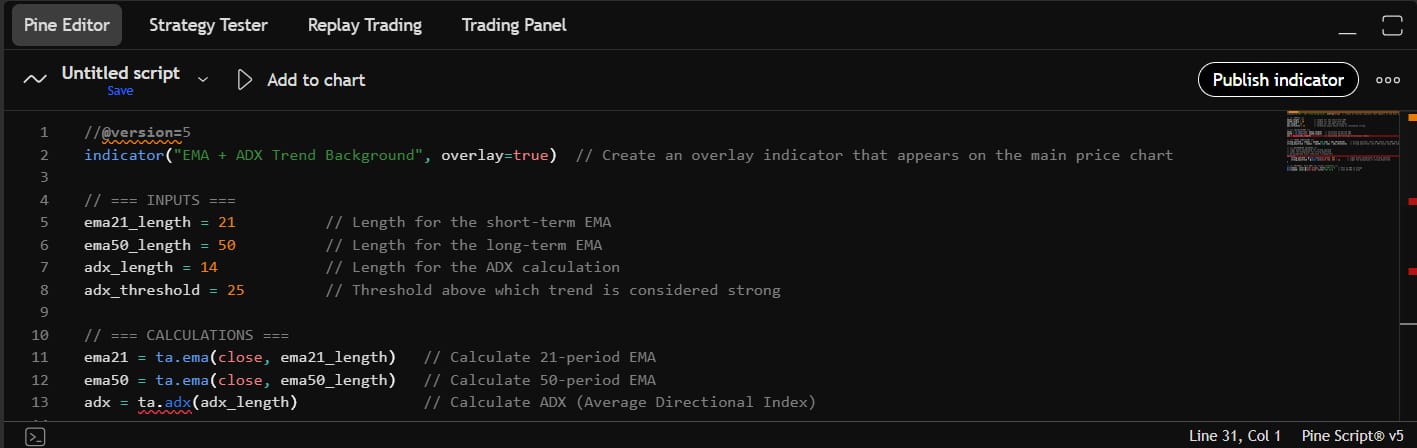
Prompt for a Trend-Confirmation Indicator:
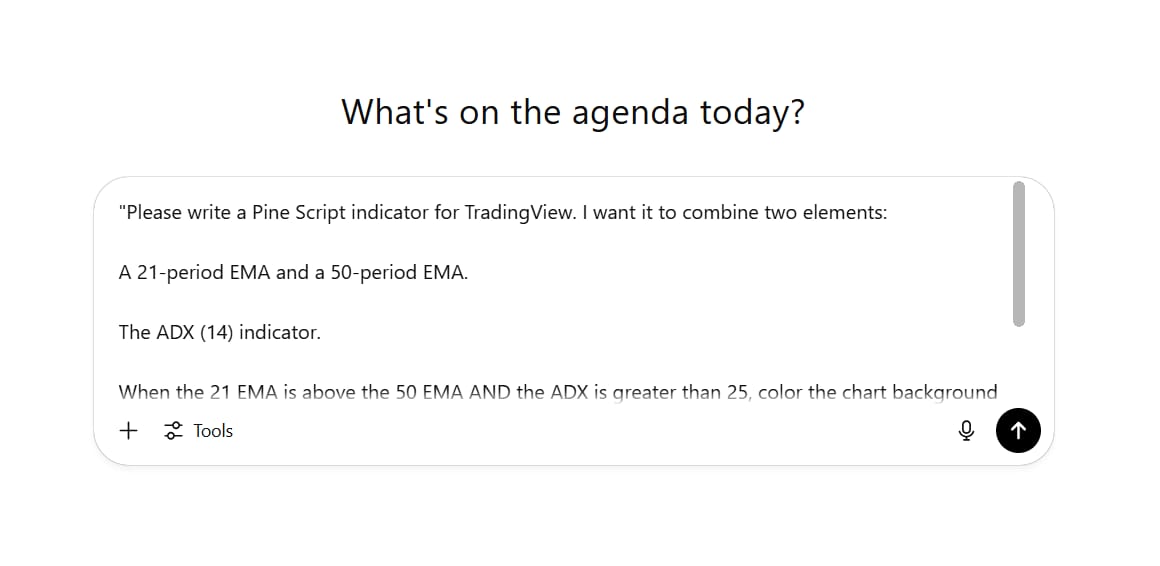
"Please write a Pine Script indicator for TradingView. I want it to combine two elements:
A 21-period EMA and a 50-period EMA.
The ADX (14) indicator.
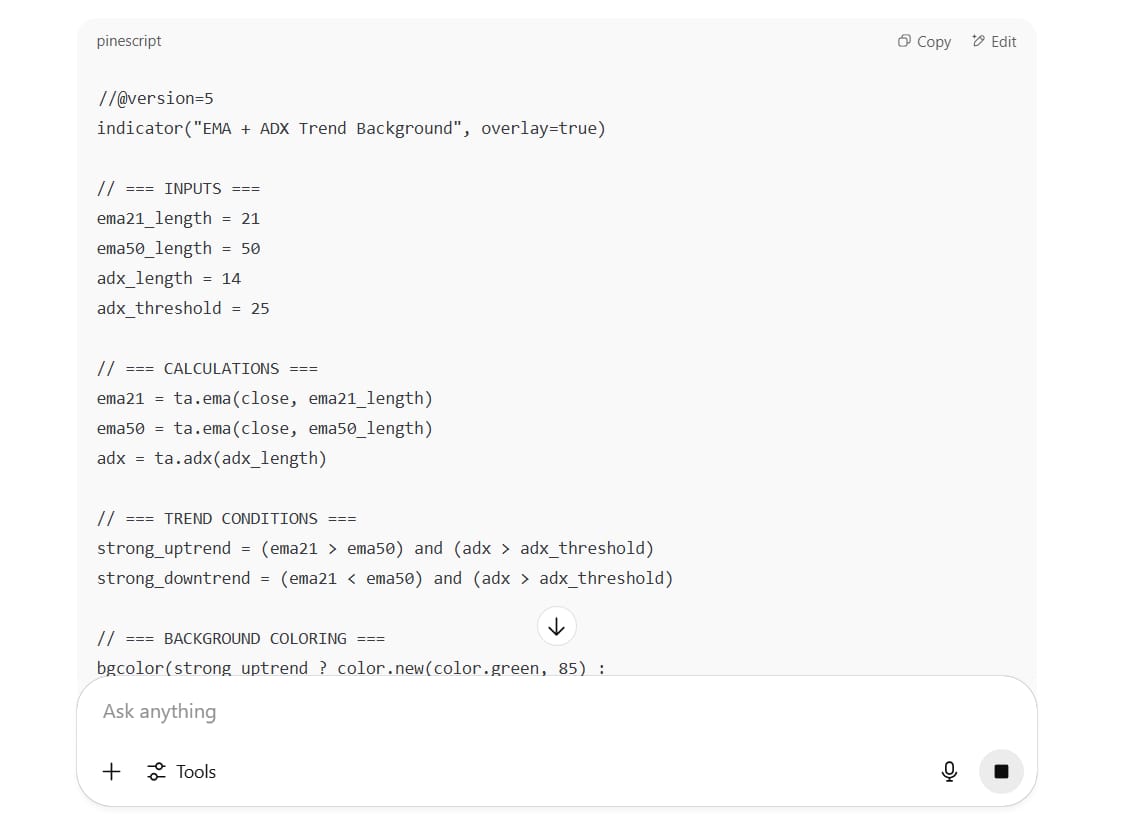
When the 21 EMA is above the 50 EMA AND the ADX is greater than 25, color the chart background a light green (signaling a strong uptrend). When the 21 EMA is below the 50 EMA AND the ADX is greater than 25, color the background a light red (signaling a strong downtrend). In all other cases, the background should be transparent."Step 2: Receive the Code and Refine
The AI will generate the Pine Script code. Ask it to add comments in the code so you can understand what each line does.
Step 3: Integrate Into TradingView
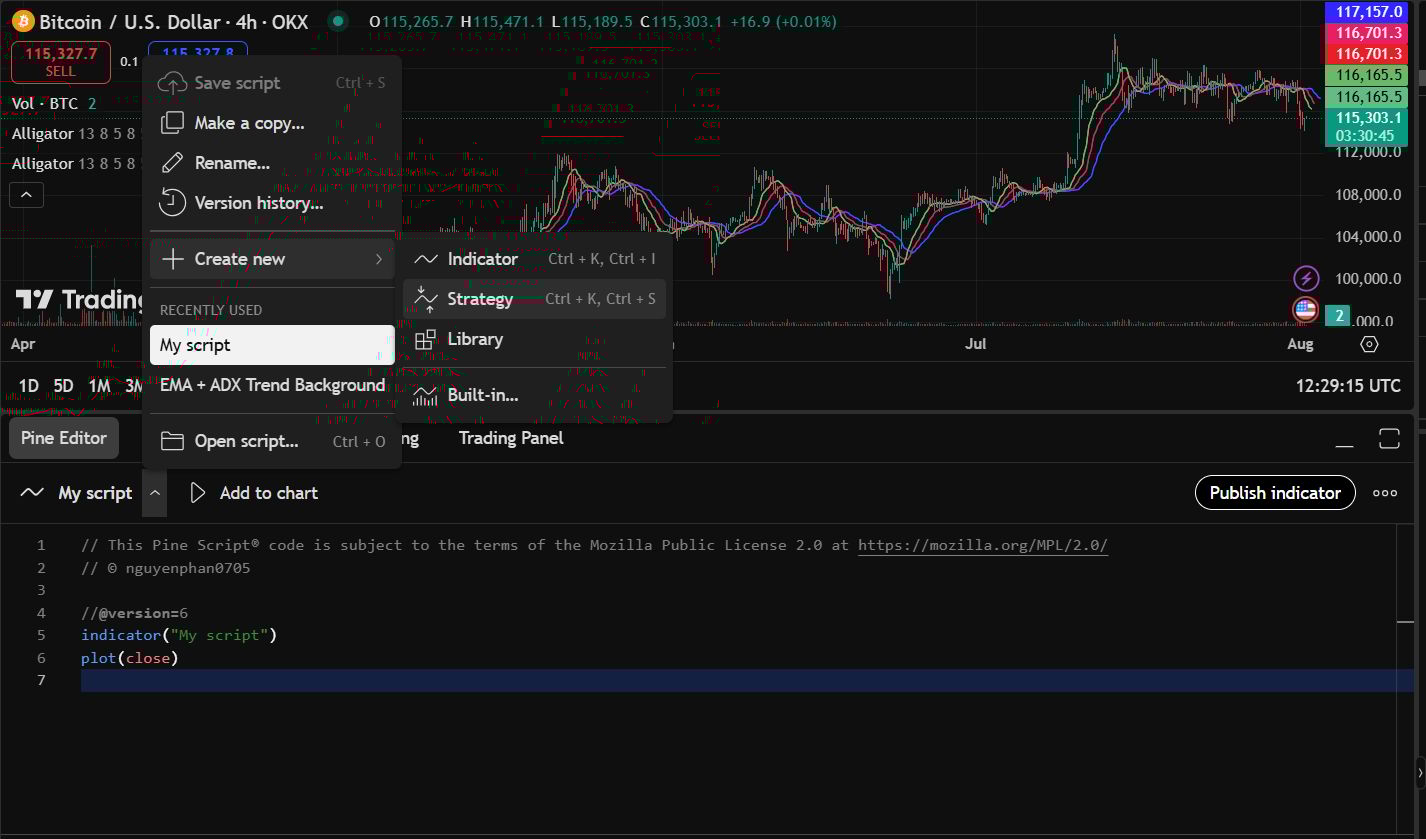
Open a chart on TradingView.
Click the "Pine Editor" tab in the bottom panel.
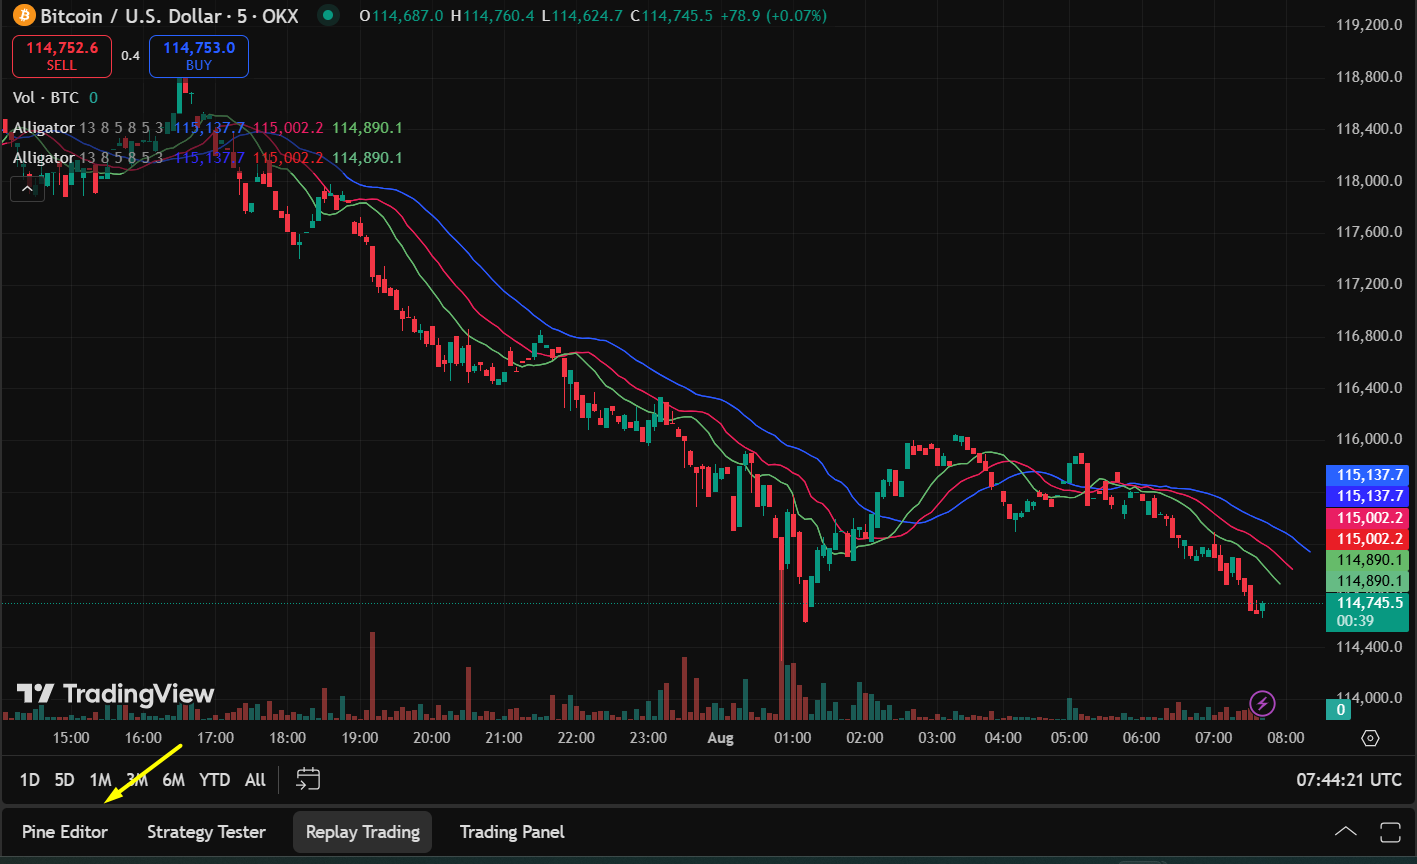
Click "Open" -> "New blank indicator."
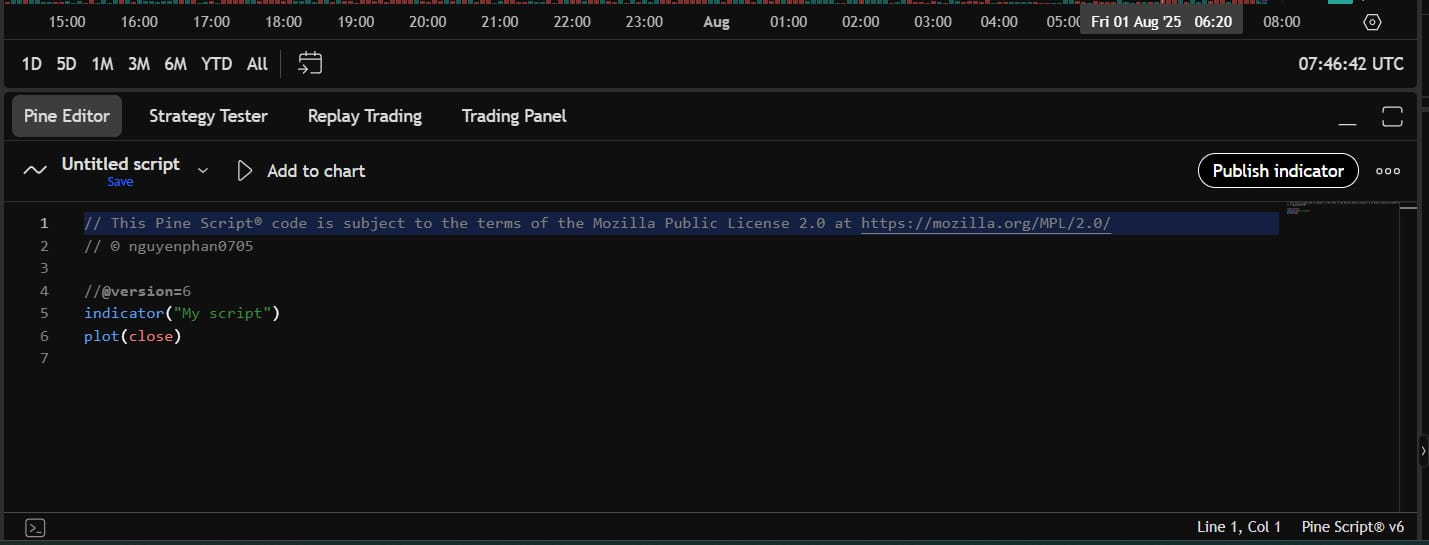
Delete all the existing template code.
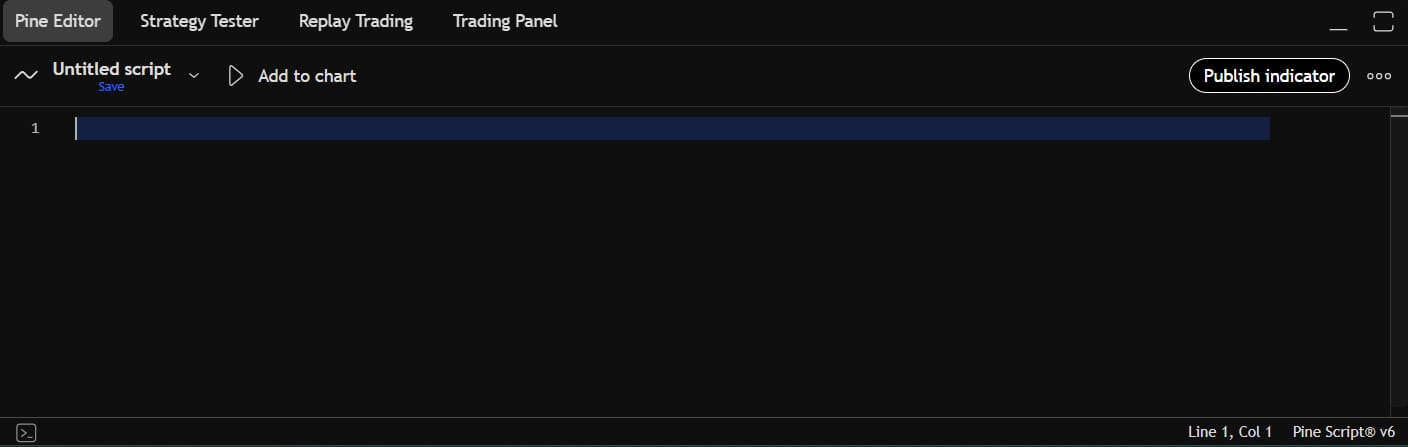
Paste the code generated by the AI into the editor.
Click "Save," give your indicator a name, and then click "Add to Chart."
Step 4: Debugging - A Normal Part Of The Process
If you get an error (this is very common), don't panic.
Take a screenshot of the error message in the console panel below the Pine Editor.
Upload the image and tell the AI: "The code you provided produced this error. Here is the error message. Please review and fix the source code."
The AI will analyze the error and provide a corrected version. Repeat the process until the indicator works perfectly.
The Beauty Of This Method:
You can experiment with countless ideas without spending a dime on development costs. You can create proprietary tools that help you see the market in your own unique way, spotting signals that standard indicators miss.
4. High-Speed Stock And Forex Fundamental Analysis With AI
Fundamental analysis is critically important but also incredibly time-consuming. Reading through hundred-page financial reports, analyzing ratios, and comparing them to competitors can be a full-time job.
The Inherent Problem:
Retail traders often lack the time or expertise to conduct in-depth fundamental analysis, causing them to overlook crucial underlying factors or make decisions based on superficial information.
AI As Your Financial Analyst:
AI can read, summarize, and analyze complex financial documents in seconds.
Step 1: Gather The Data
You can provide data to the AI in various forms:

Copy and Paste: Copy an analyst article, an earnings report transcript, or statistics from a financial website.
Upload Documents: Upload PDF files of annual reports (10-K), quarterly reports (10-Q), or investor conference call transcripts.
Step 2: Ask In-Depth Analytical Questions
Prompt for Financial Report Analysis:
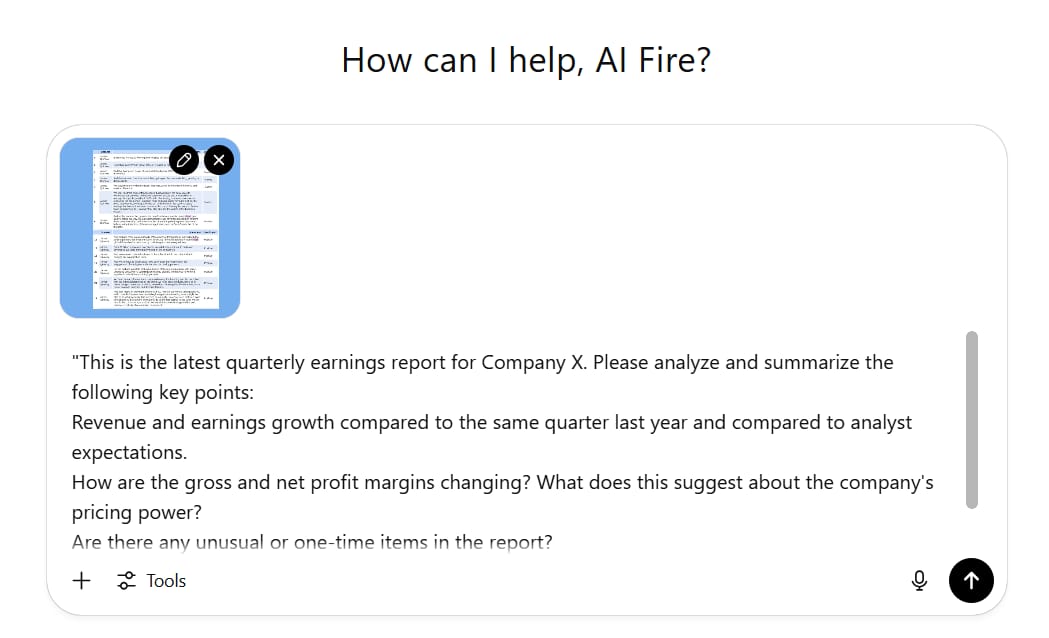
"This is the latest quarterly earnings report for Company X. Please analyze and summarize the following key points:
Revenue and earnings growth compared to the same quarter last year and compared to analyst expectations.
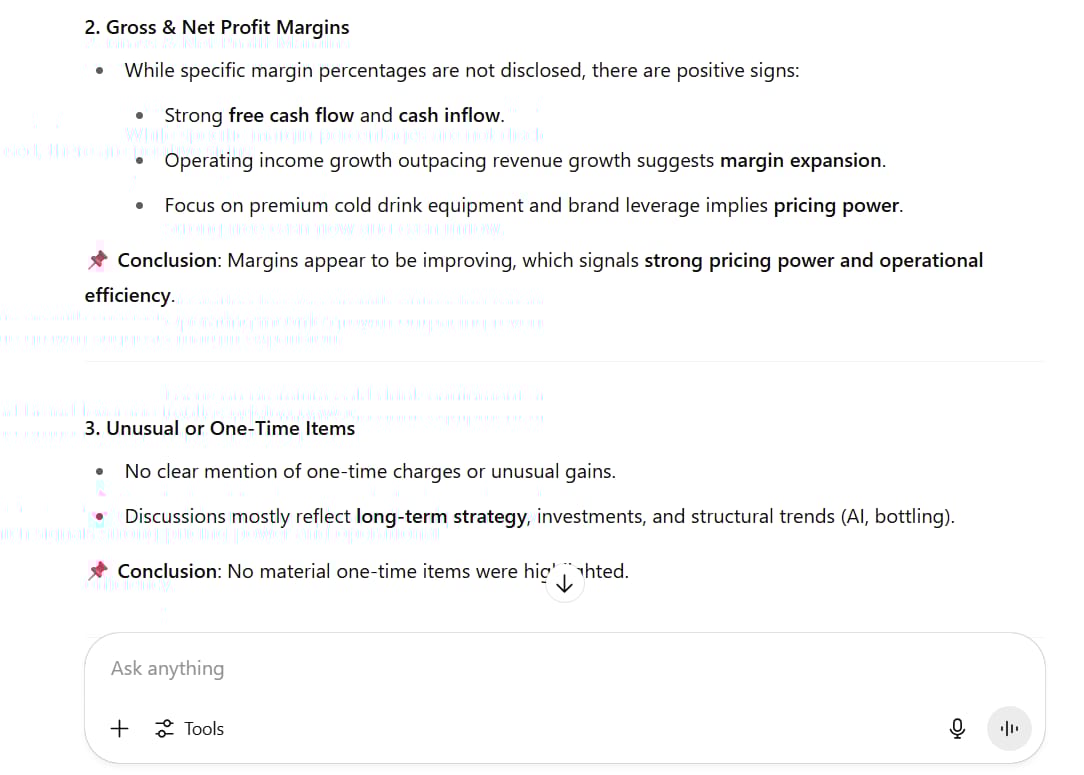
How are the gross and net profit margins changing? What does this suggest about the company's pricing power?
Are there any unusual or one-time items in the report?
What were the main risks mentioned by management in the discussion section?"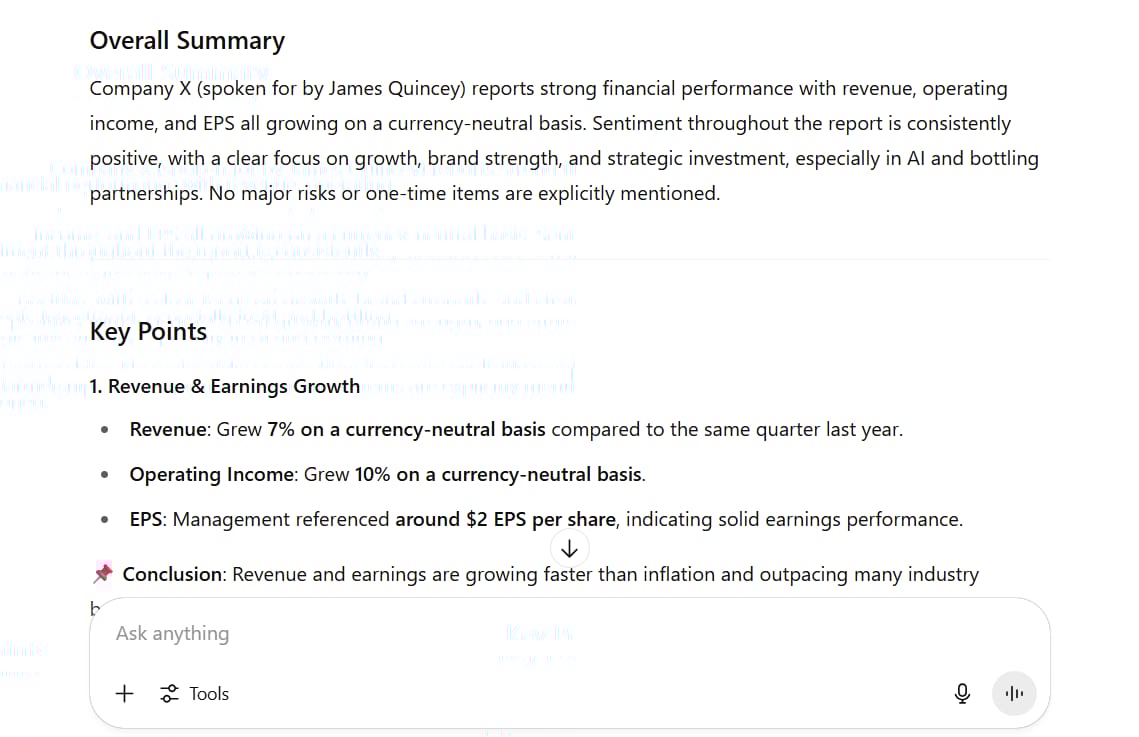
Prompt for Competitor Comparison:
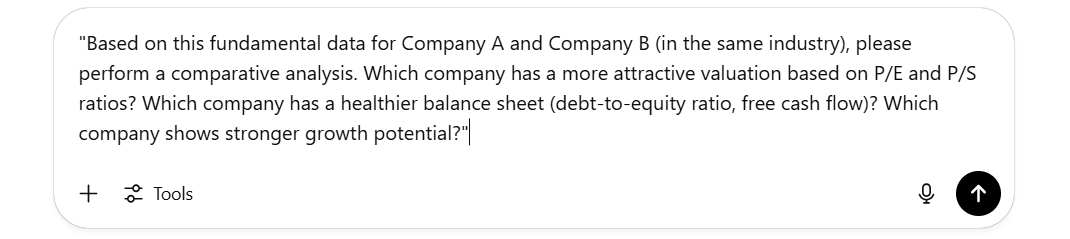
"Based on this fundamental data for Company A and Company B (in the same industry), please perform a comparative analysis. Which company has a more attractive valuation based on P/E and P/S ratios? Which company has a healthier balance sheet (debt-to-equity ratio, free cash flow)? Which company shows stronger growth potential?"Step 3: Receive Unbiased, Detailed Insights
The AI will provide a summary free from hype:
Speed and Precision: Processes everything in seconds, extracting exact figures.
Unbiased View: Focuses solely on the data, unswayed by the market's "story" or excitement.
Simple Explanations: Translates complex financial jargon into easy-to-understand language.
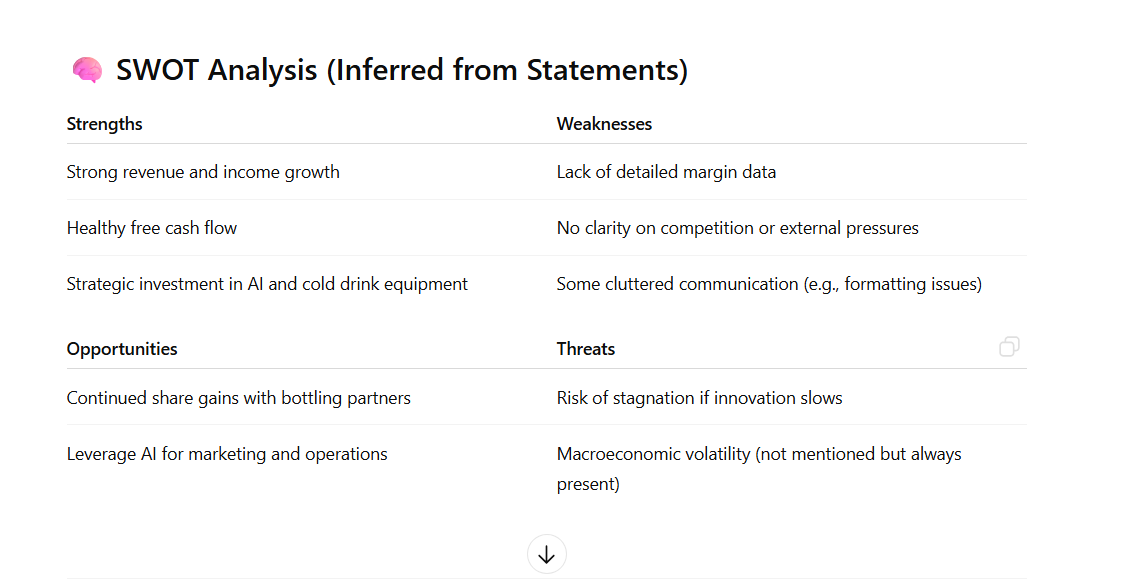
SWOT Analysis: Often points out Strengths, Weaknesses, Opportunities, and Threats.
The Strategic Advantage:

Work that once took hours of research now takes minutes. You get analyses of the quality of a personal financial team, helping you make wiser investment decisions based on a solid foundation.
5. "Stress-Test" Your Trading Strategy With AI
Every trader has blind spots in their strategy. Perhaps your strategy works wonderfully in a trending market but fails miserably in a sideways market. AI can act as a "devil's advocate," helping you find these flaws before the market does.

The Inherent Problem:
Traders often fall in love with their strategies and find it difficult to view them objectively. They may overlook obvious weaknesses or fail to anticipate market conditions where the strategy will fail.
How AI Critiques Your Strategy:
By providing a logical and emotionless analysis, AI helps you see the hard truth about your trading system.
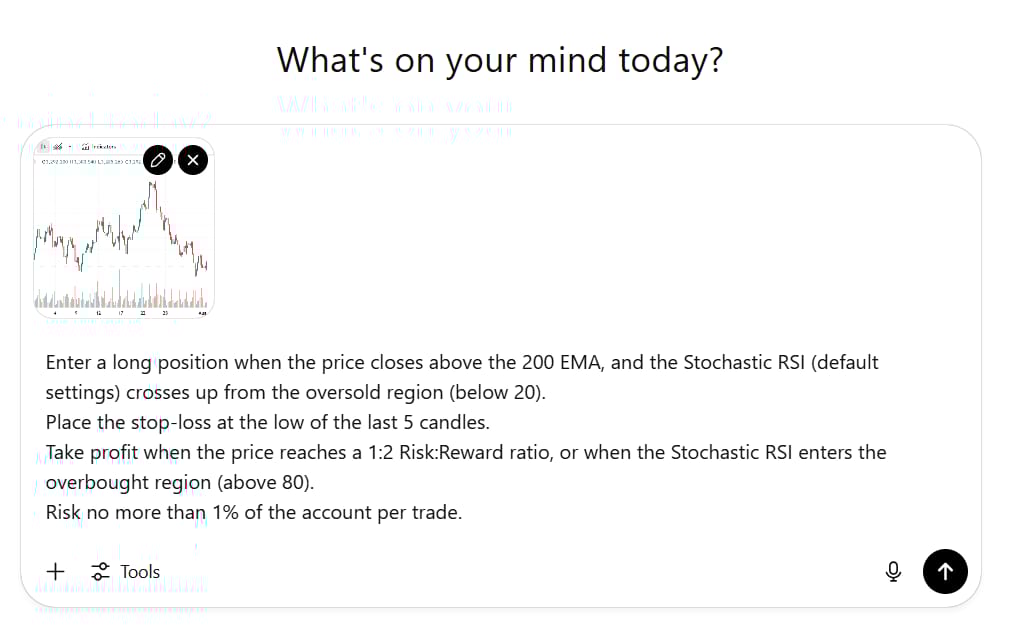
Step 1: Present Your Rules In Detail
Be specific. Give the AI your entire system:
Market/Timeframe: e.g., "The XAU/USD pair on the H4 timeframe."
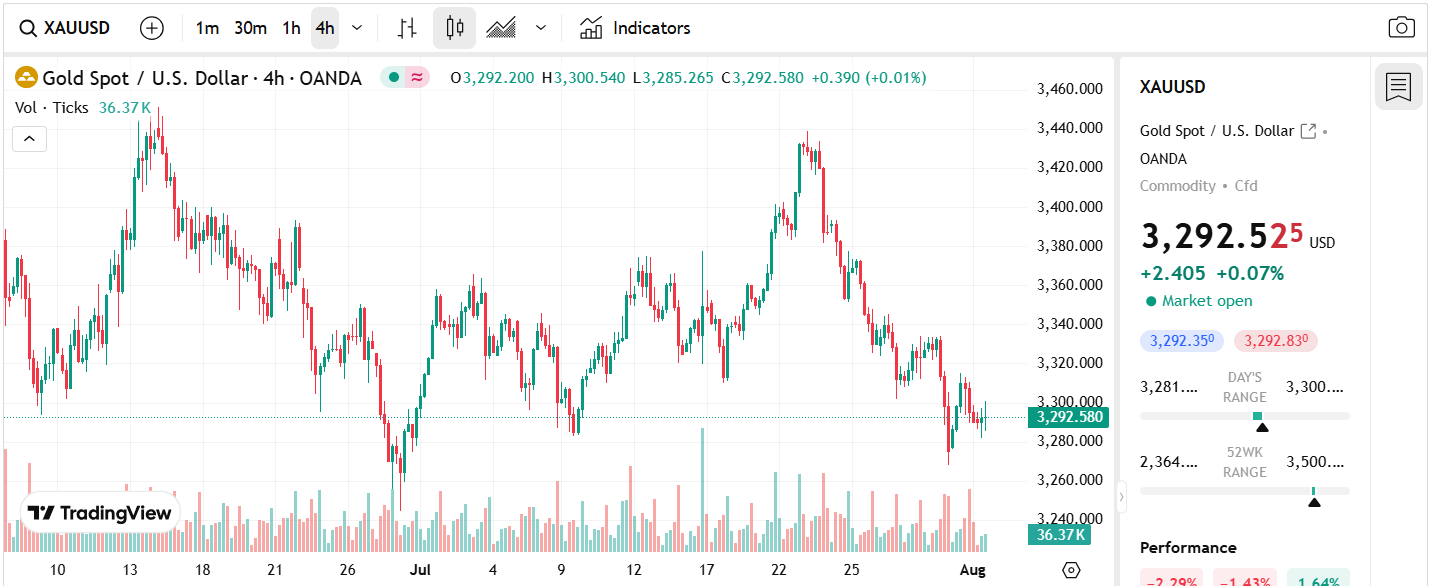
Entry Rules: e.g., "Enter a long position when the price closes above the 200 EMA, and the Stochastic RSI (default settings) crosses up from the oversold region (below 20)."
Stop-Loss Rule: e.g., "Place the stop-loss at the low of the last 5 candles."
Take-Profit Rule: e.g., "Take profit when the price reaches a 1:2 Risk:Reward ratio, or when the Stochastic RSI enters the overbought region (above 80)."
Risk Management Rule: e.g., "Risk no more than 1% of the account per trade."
Step 2: Demand Brutal Honesty
Don't let the AI be a "yes-man." Command it:
"Stress Test" Prompt:
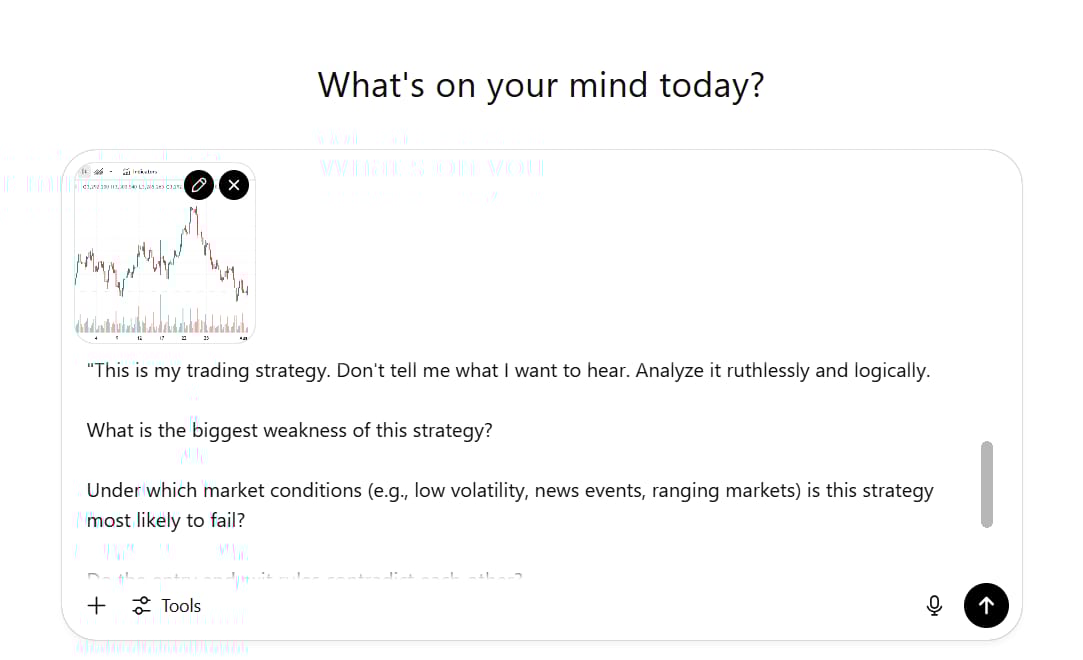
"This is my trading strategy. Don't tell me what I want to hear. Analyze it ruthlessly and logically.

What is the biggest weakness of this strategy?

Under which market conditions (e.g., low volatility, news events, ranging markets) is this strategy most likely to fail?

Do the entry and exit rules contradict each other?

Does this strategy have a real statistical edge, or is it just based on luck? Please suggest 2-3 ways to improve it and make it more robust."
Step 3: Absorb And Improve
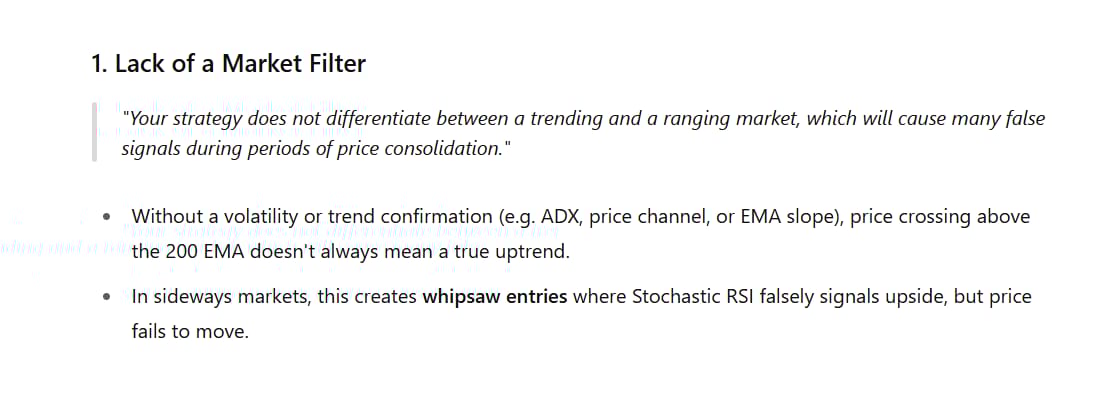
AI can uncover critical blind spots:
Lack of a Market Filter: "Your strategy does not differentiate between a trending and a ranging market, which will cause many false signals during periods of price consolidation."
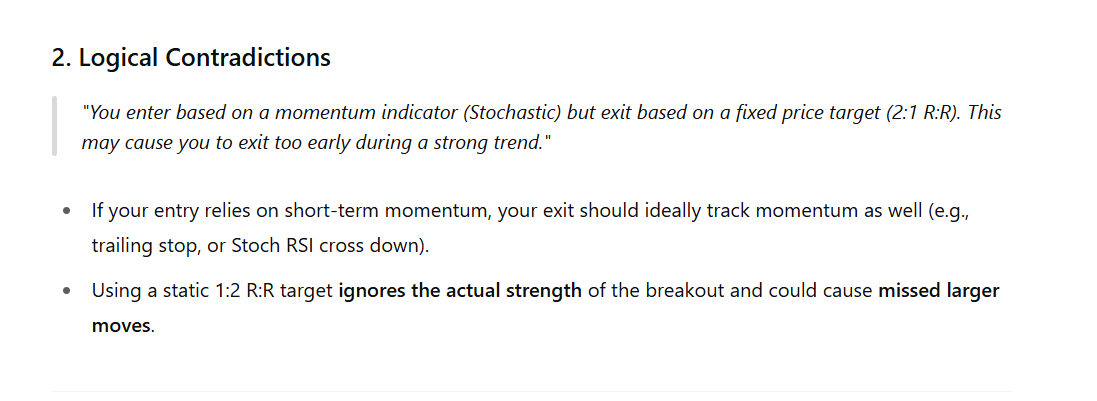
Logical Contradictions: "You enter based on a momentum indicator (Stochastic) but exit based on a fixed price target (2:1 R:R). This may cause you to exit too early during a strong trend."
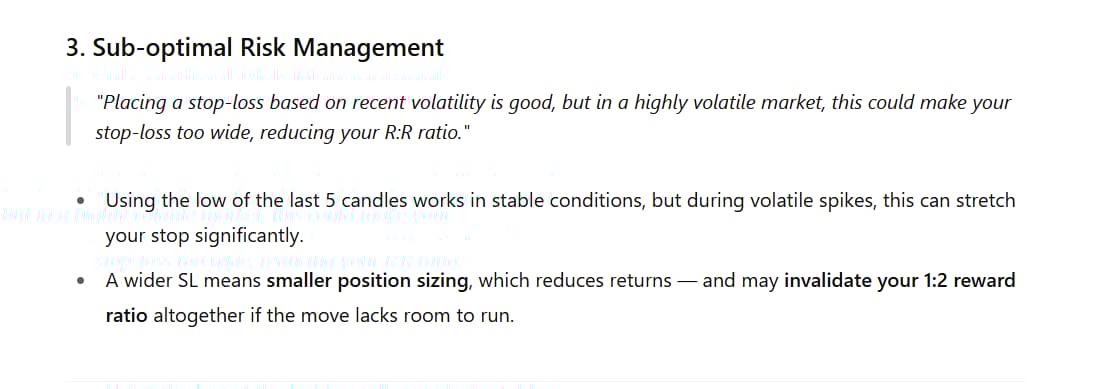
Sub-optimal Risk Management: "Placing a stop-loss based on recent volatility is good, but in a highly volatile market, this could make your stop-loss too wide, reducing your R:R ratio."
This method is far more effective than self-assessment because it completely removes ego and emotion, giving you an objective review based on pure logic.
6. Intelligent Stock And Crypto Screening With AI
Screening tools on platforms like TradingView are powerful, but staring at a list of hundreds of stocks can still be overwhelming. AI can help you analyze the screener results to find the hidden gems.
The Inherent Problem:
After running a filter, traders still have to manually analyze each stock on the list, a repetitive and time-consuming process. They might miss broader sector trends or subtle patterns in the data.
AI As A Market Data Analyst:
You can treat AI like a data analyst who can look at your results table and draw insightful conclusions.
Step 1: Take A Screenshot Of Your Screener Results
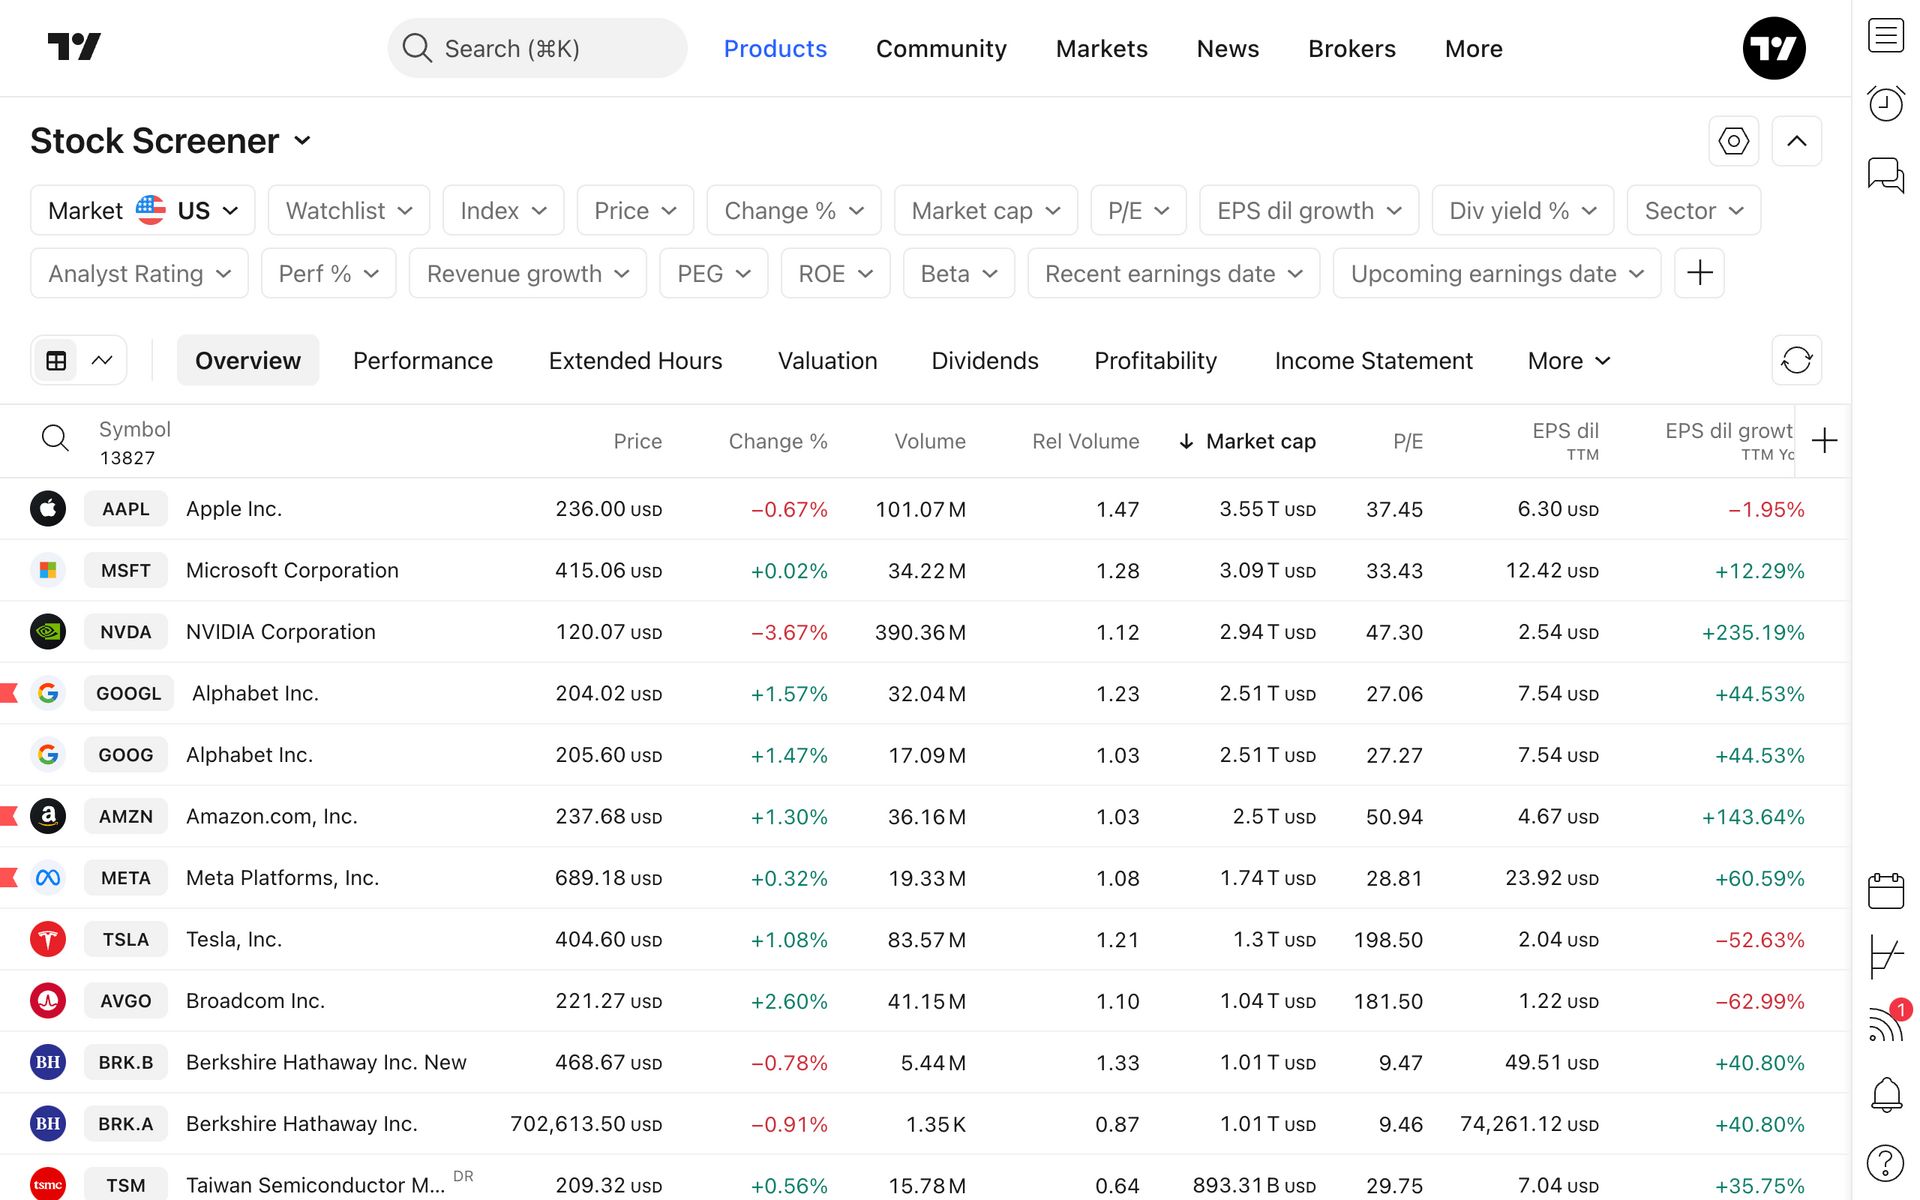
Run your screener on TradingView (e.g., US tech stocks with a market cap over $10B, P/E under 25, and price above the 50-day SMA). Take a screenshot of the results table.
Step 2: Ask Exploratory Questions
Upload the image and ask:
Prompt for Sector Analysis:
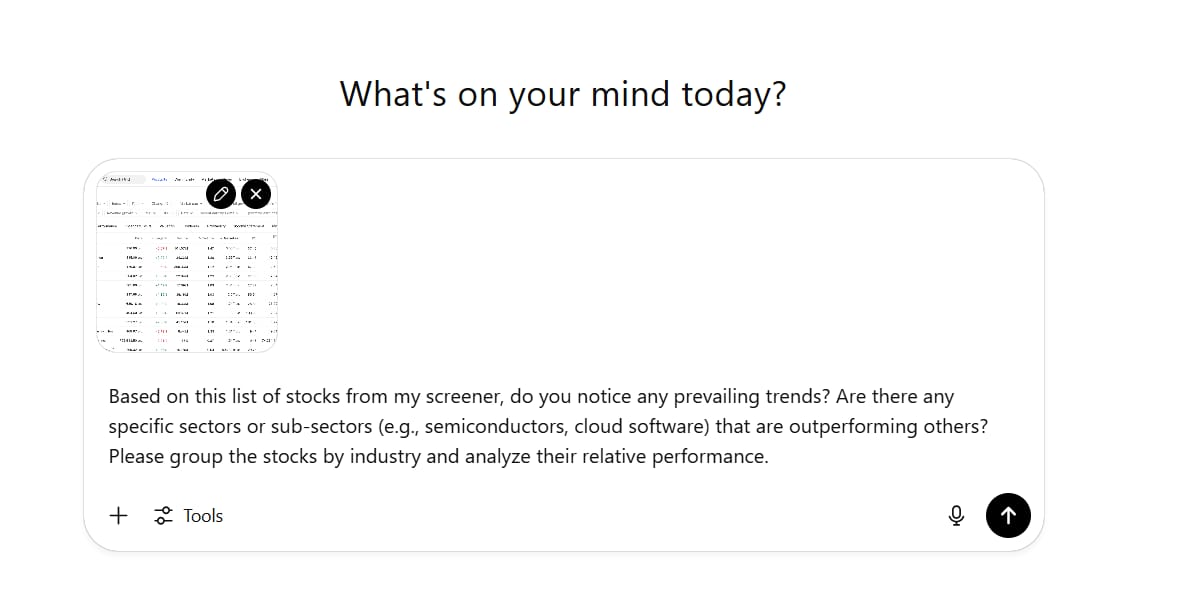
"Based on this list of stocks from my screener, do you notice any prevailing trends? Are there any specific sectors or sub-sectors (e.g., semiconductors, cloud software) that are outperforming others? Please group the stocks by industry and analyze their relative performance."Prompt to Find Anomalies:
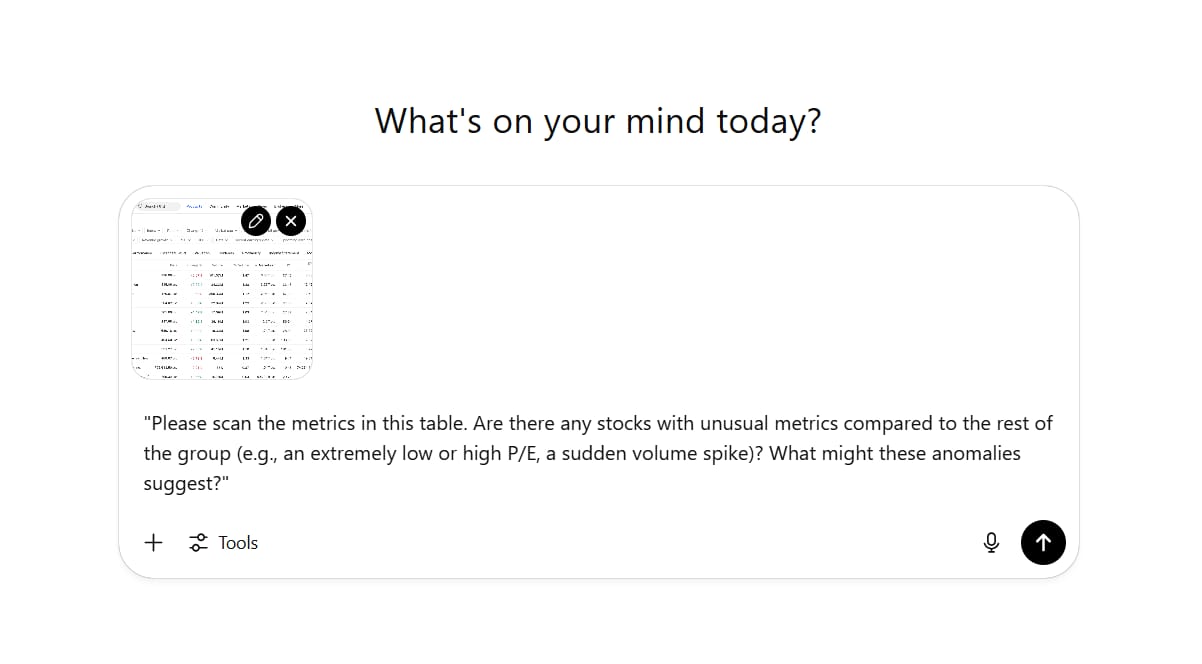
"Please scan the metrics in this table. Are there any stocks with unusual metrics compared to the rest of the group (e.g., an extremely low or high P/E, a sudden volume spike)? What might these anomalies suggest?"Prompt to Optimize the Screener:
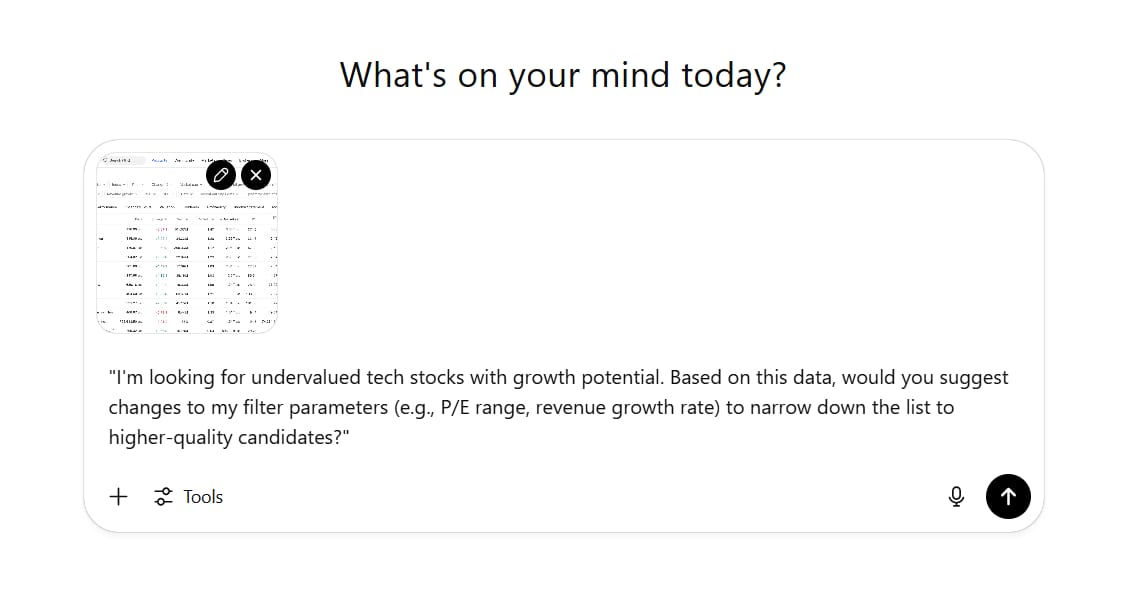
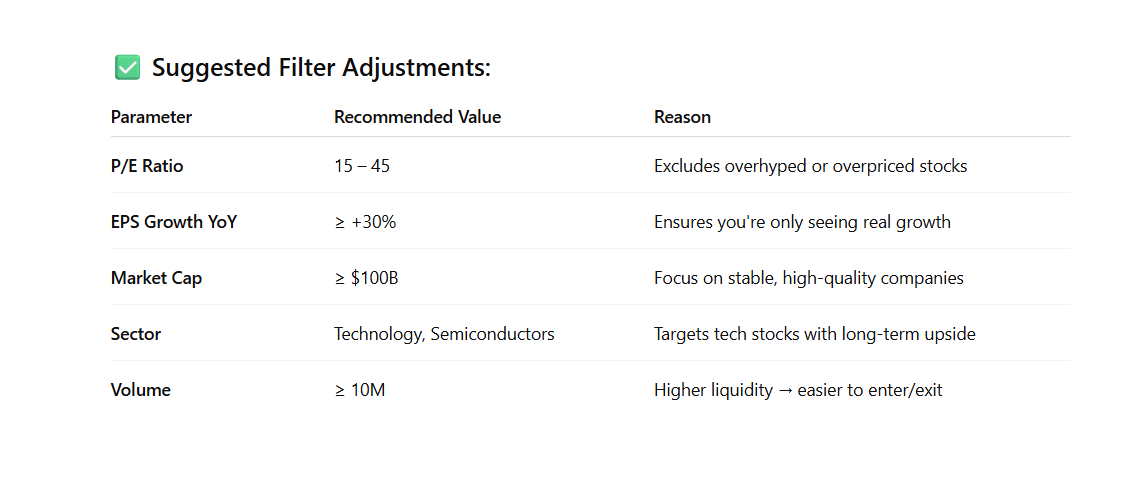
"I'm looking for undervalued tech stocks with growth potential. Based on this data, would you suggest changes to my filter parameters (e.g., P/E range, revenue growth rate) to narrow down the list to higher-quality candidates?"Step 3: Get Actionable Insights
AI will help you:
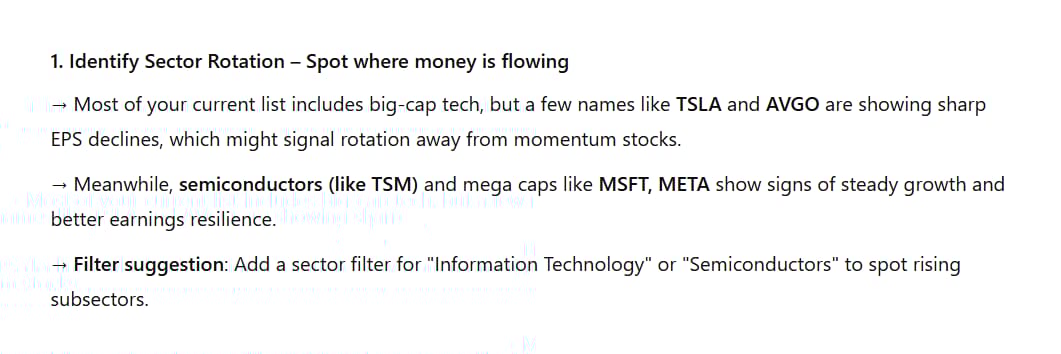
Identify Sector Rotation: Quickly spot which sectors money is flowing into.
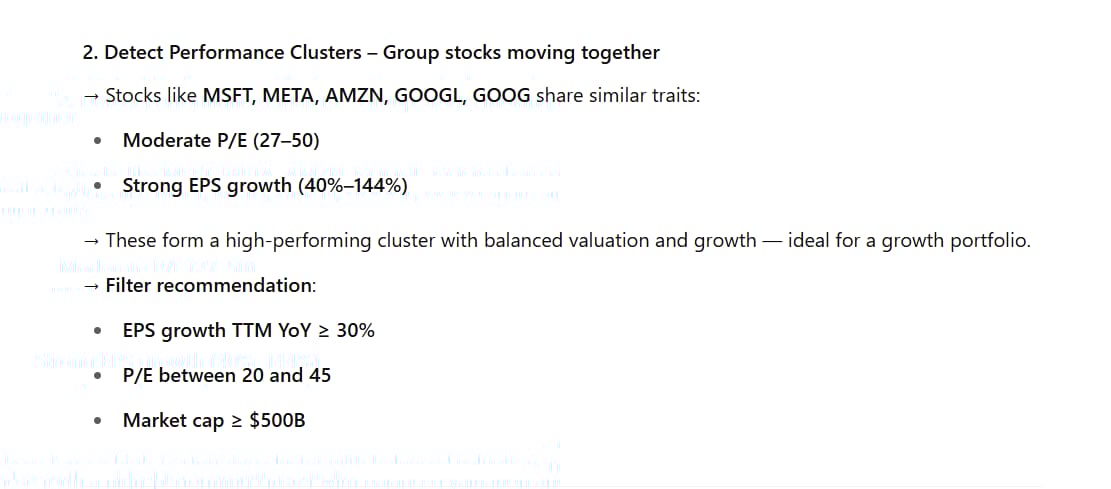
Detect Performance Clusters: Find groups of stocks that are moving together.
Flag Outliers: Highlight stocks with suspicious stats that warrant further investigation.
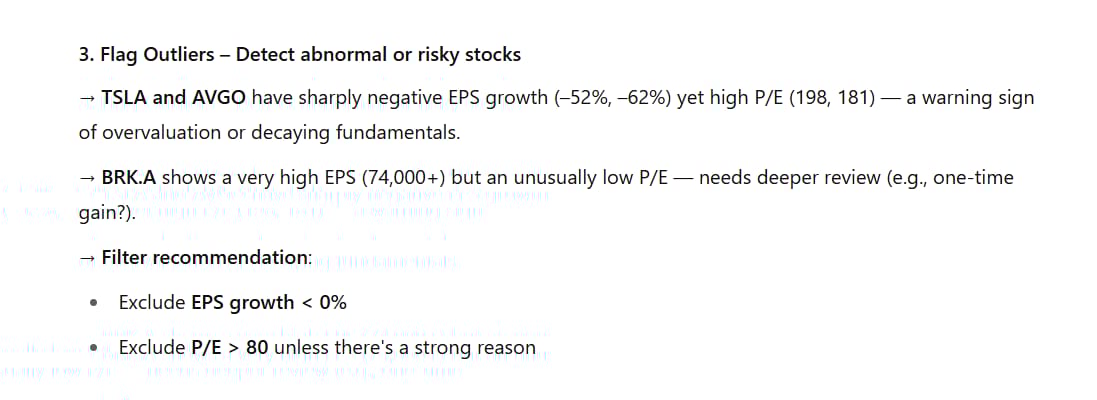
Strategy For Earnings Season:
As earnings season approaches, run your screener and ask the AI: "From this list, which stocks have an upcoming earnings release in the next 2 weeks? Based on their recent performance and sector, which ones might see significant volatility post-earnings?". The AI will instantly narrow your list down to a few of the most promising candidates.
7. Convert Indicators Into Trading Strategies And Bots With AI
Do you love a certain indicator but have no idea how it would actually perform as a trading system? AI can help you convert that indicator into a complete, backtestable strategy.
The Inherent Problem:
An indicator only provides a visual cue. It doesn't give you specific entry, exit, or risk management rules. Therefore, it's very difficult to objectively assess its true effectiveness.
AI As A Trading System Developer:
AI can add trading logic to an indicator's source code, turning it into an automated system.
Step 1: Get The Source Code Of Your Favorite Indicator
Find the Pine Script code for that indicator. For example, we could use the SuperTrend indicator.
Step 2: Ask AI To Convert It
Copy the source code and make a clear request:
Conversion Prompt:
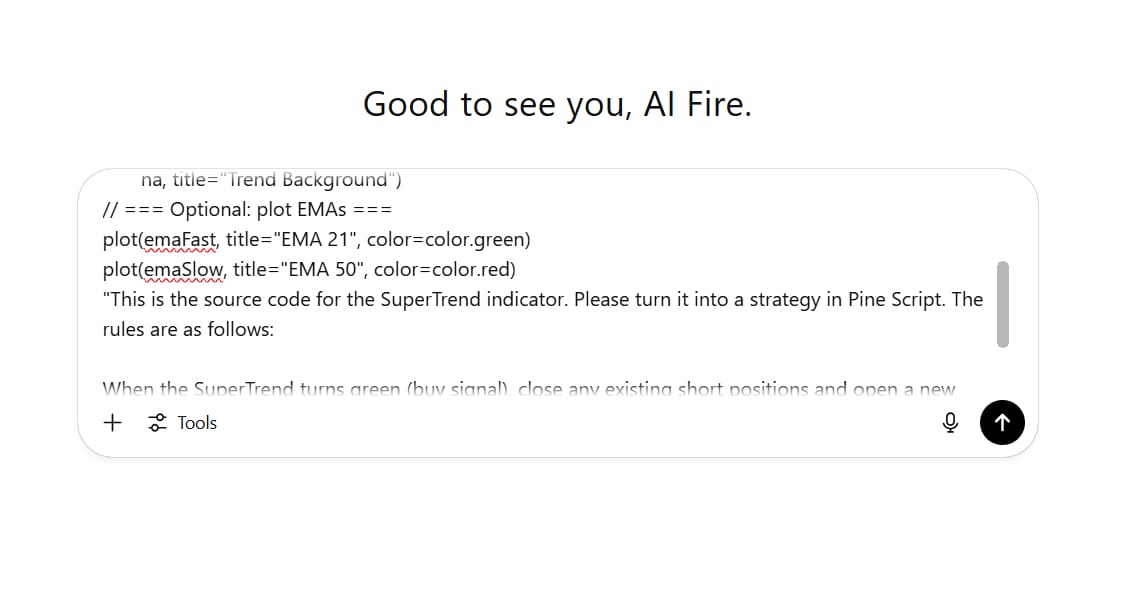
"This is the source code for the SuperTrend indicator. Please turn it into a strategy in Pine Script. The rules are as follows:

When the SuperTrend turns green (buy signal), close any existing short positions and open a new long position.

When the SuperTrend turns red (sell signal), close any existing long positions and open a new short position.

The strategy must always be in the market, either long or short.

Please add inputs so I can adjust the contract quantity and slippage in the settings."
Step 3: Implement and Backtest
Copy the strategy code generated by the AI.
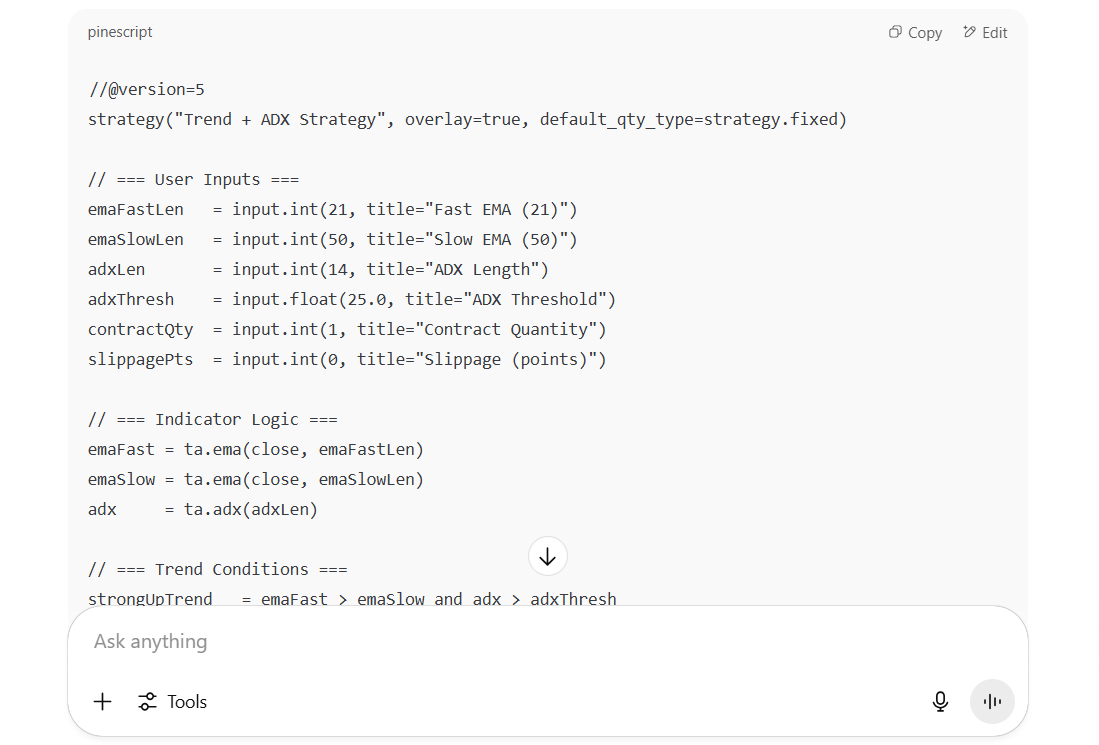
Paste it into the Pine Editor on TradingView as a "New blank strategy."
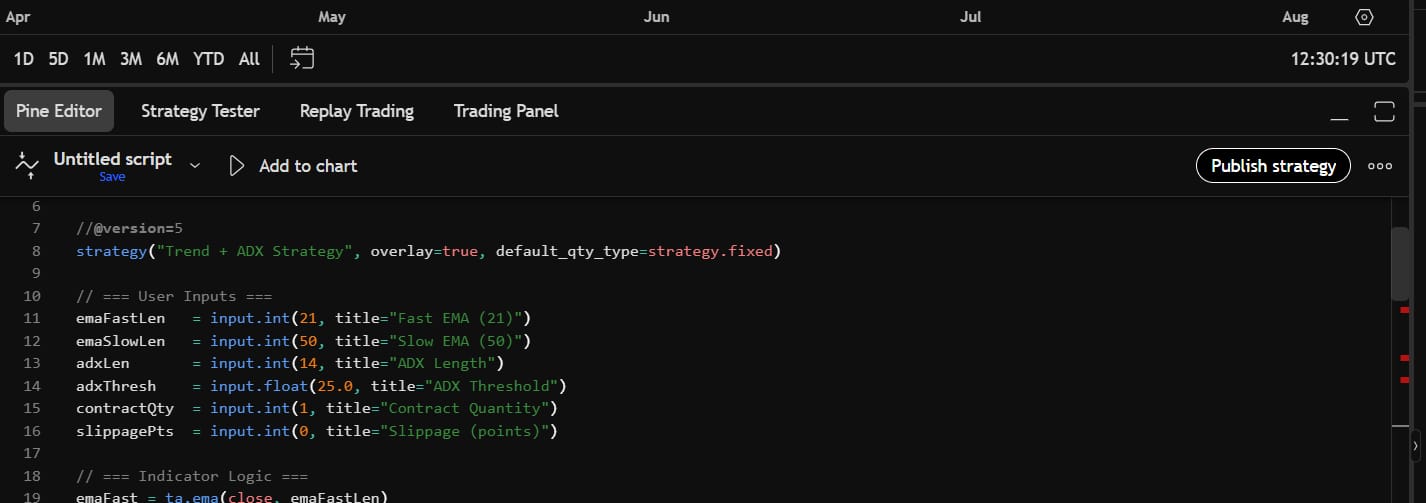
Save and add it to the chart.
Go to the "Strategy Tester" tab in the bottom panel to see detailed backtest results (net profit, max drawdown, profit factor, etc.).
Step 4: Optimize With AI
If the initial results are not satisfactory, continue working with the AI:
Optimization Prompt:
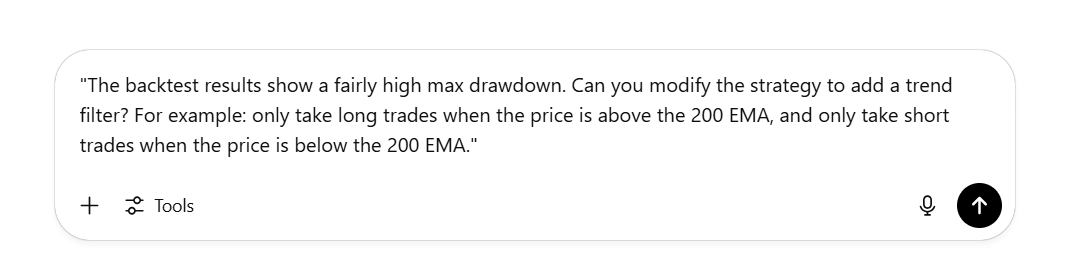
"The backtest results show a fairly high max drawdown. Can you modify the strategy to add a trend filter? For example: only take long trades when the price is above the 200 EMA, and only take short trades when the price is below the 200 EMA."Risk Management Prompt:
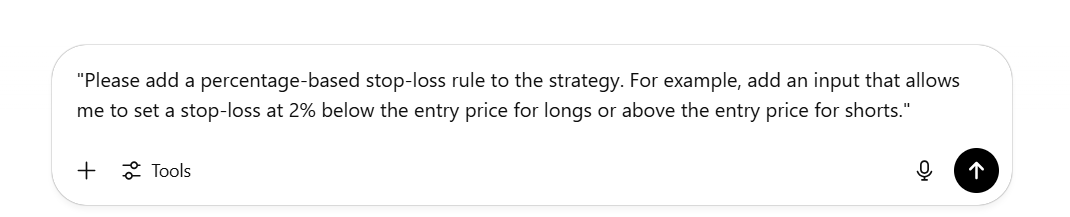
"Please add a percentage-based stop-loss rule to the strategy. For example, add an input that allows me to set a stop-loss at 2% below the entry price for longs or above the entry price for shorts."You can iterate through this process, adding filters, changing exit logic, and testing different parameters until you find a version of the strategy that fits your risk appetite and goals.
8. Build An Intelligent Trading Journal With AI
A detailed trading journal is the most powerful tool for self-improvement, yet most traders are lazy about maintaining one. AI can help you create a journaling system that is not only easy to use but also capable of deep analysis.
The Inherent Problem:
Manual journaling is tedious and difficult to analyze. Traders often just record P&L and ignore critical psychological and decision-making factors, losing out on valuable lessons.
AI As A Systems Architect:
AI can design a perfect journal template and then help you analyze the data you collect.
Step 1: Ask AI To Build Your Template
Ask the AI to create a spreadsheet template (Google Sheets or Excel):
Template Prompt:
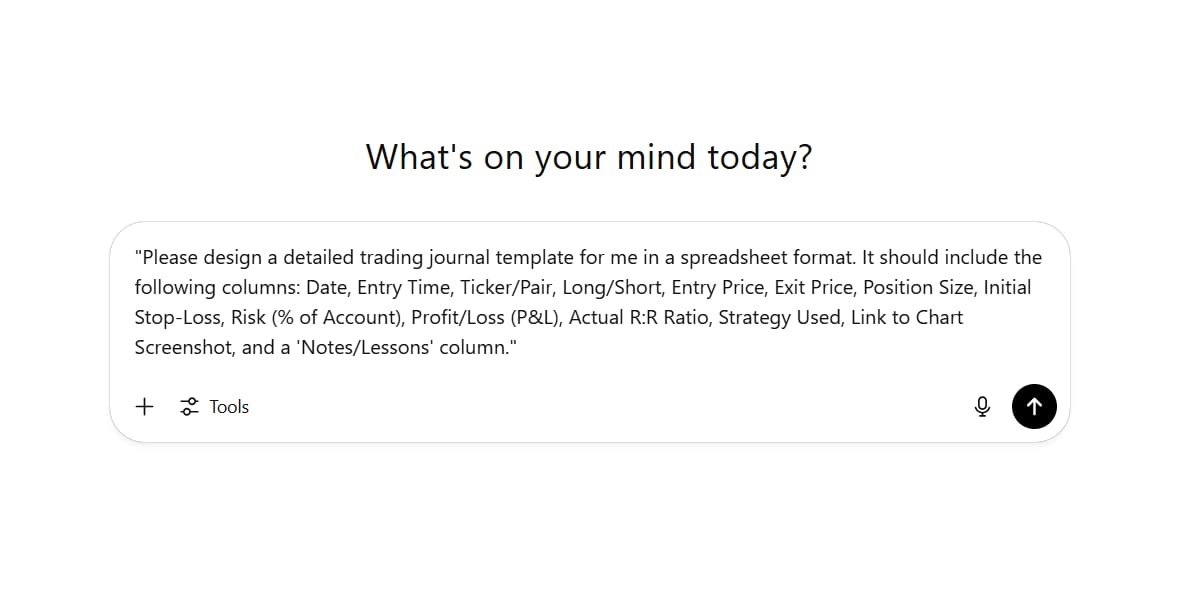
"Please design a detailed trading journal template for me in a spreadsheet format. It should include the following columns: Date, Entry Time, Ticker/Pair, Long/Short, Entry Price, Exit Price, Position Size, Initial Stop-Loss, Risk (% of Account), Profit/Loss (P&L), Actual R:R Ratio, Strategy Used, Link to Chart Screenshot, and a 'Notes/Lessons' column."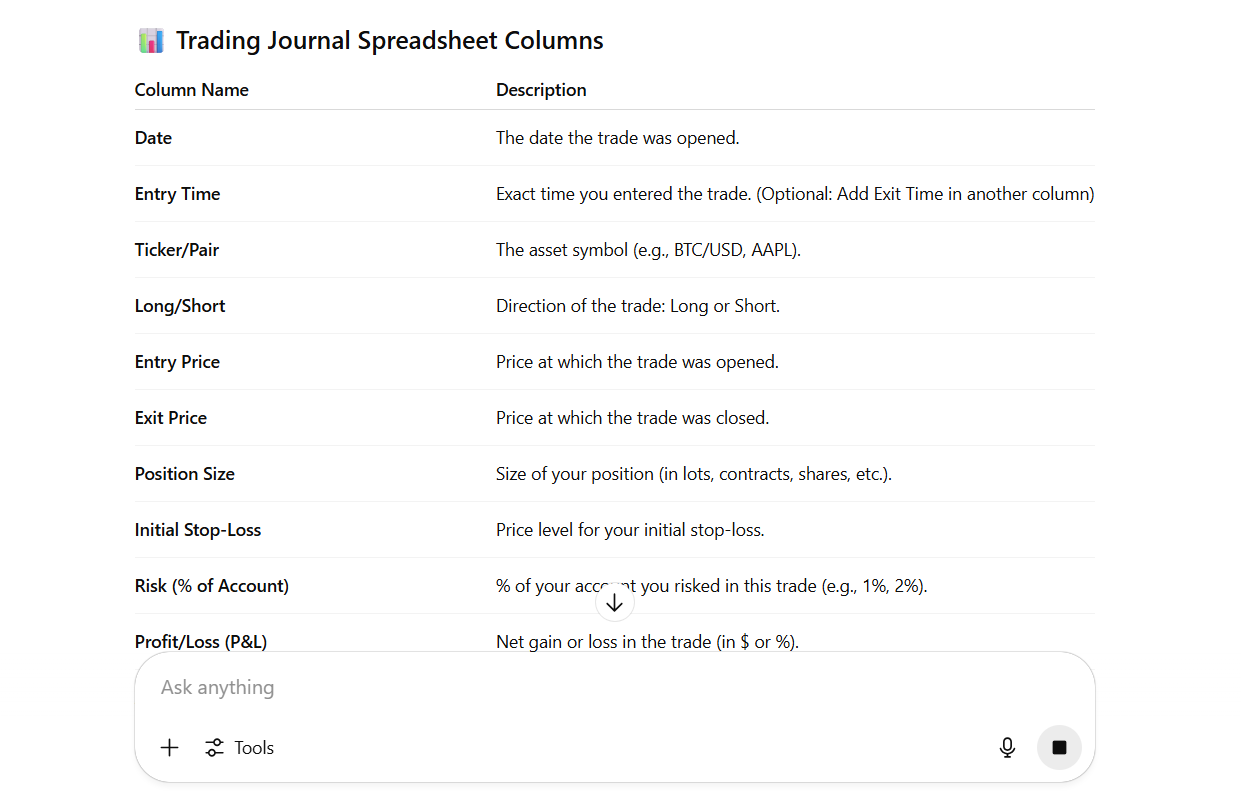
Step 2: Add Automatic Calculations
Formula Prompt:
"Great. Now, please add a 'Dashboard' tab to this spreadsheet. This tab should automatically calculate and display the following metrics from the data in the journal:

Total P&L

Win Rate %

Average Profit per Winning Trade

Average Loss per Losing Trade

Profit Factor (Total Profits / Total Losses)

Largest Drawdown

Please provide the exact formulas for each of these metrics."
Step 3: Create A Structure For Notes
This is the most important part. Ask the AI to help you reflect more deeply:
Notes Prompt:
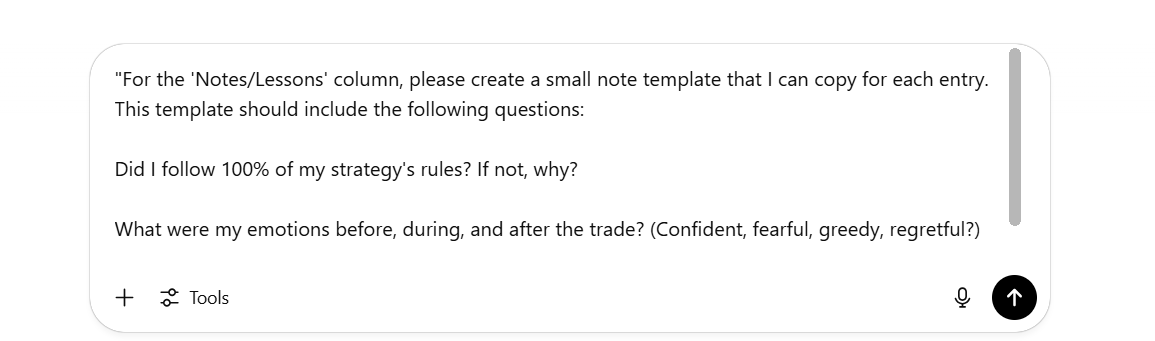
"For the 'Notes/Lessons' column, please create a small note template that I can copy for each entry. This template should include the following questions:

Did I follow 100% of my strategy's rules? If not, why?

What were my emotions before, during, and after the trade? (Confident, fearful, greedy, regretful?)

What is the most important lesson from this trade?"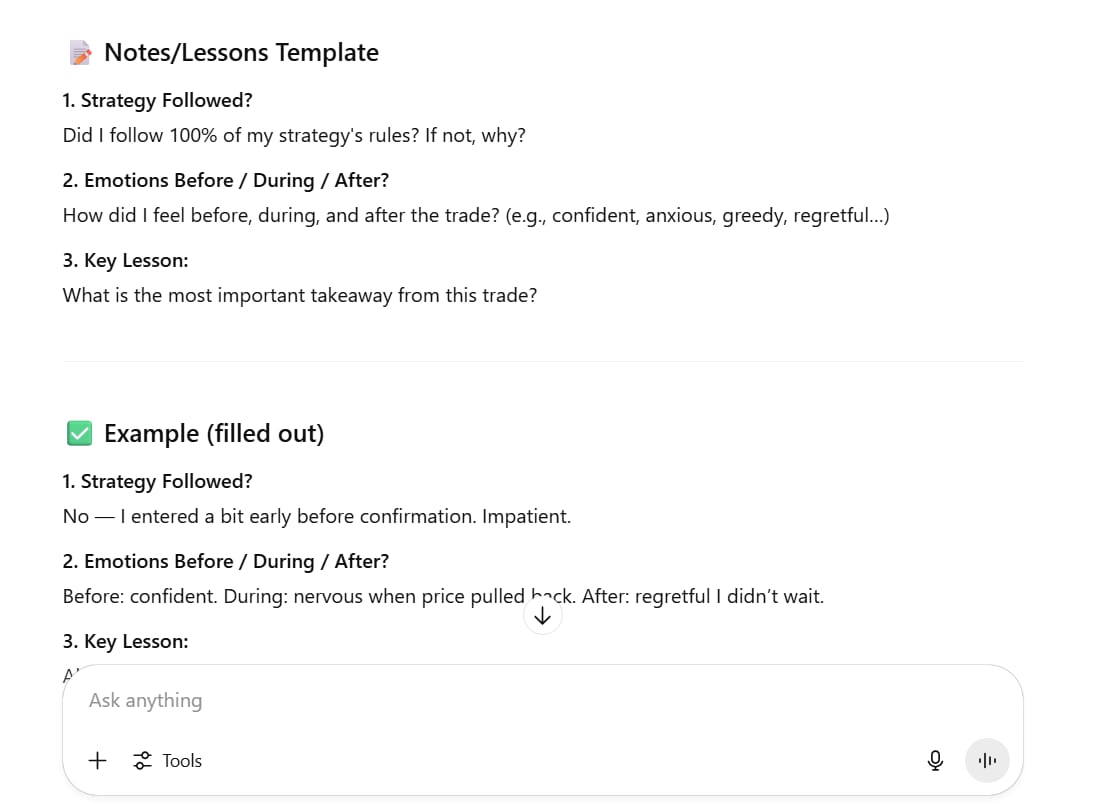
Step 4: Analyze Your Journal With AI
After you've logged 30-50 trades, the real magic begins.
Export your journal data (excluding sensitive info) and provide it to the AI.
Ask a game-changing question:
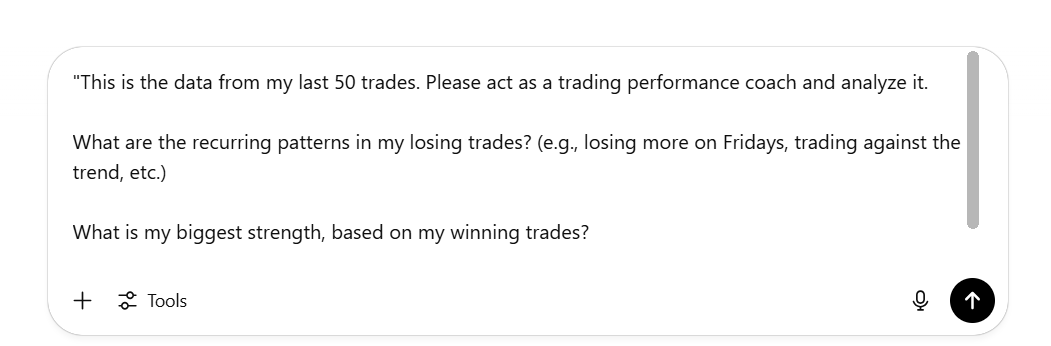
"This is the data from my last 50 trades. Please act as a trading performance coach and analyze it.

What are the recurring patterns in my losing trades? (e.g., losing more on Fridays, trading against the trend, etc.)

What is my biggest strength, based on my winning trades?

Based on the data, suggest the single most impactful change I could make to my trading behavior."
AI will find patterns you never would have noticed, such as a subconscious tendency to increase risk after a losing streak, or that your best trades always come from one specific setup.
Pitfalls To Avoid When Using AI In Trading
While AI is an incredibly powerful tool, it is not a silver bullet. Using it blindly can lead to even worse mistakes. Keep these pitfalls in mind:

Garbage In, Garbage Out: The quality of the AI's analysis is entirely dependent on the quality of the data you provide. If you give it a noisy chart, a vague set of rules, or incomplete data, it will produce useless or even harmful results.
Over-Reliance (The "Autopilot" Trap): Never completely delegate your decision-making to AI. Treat it as an extremely intelligent "co-pilot," but you are still the "pilot." You must be the one to make the final decision, combining the AI's analysis with your own understanding, experience, and market context.
AI Hallucinations: Large language models can sometimes "make up" information or analyses that are not present in the data. Always cross-check. If the AI says there is a head-and-shoulders pattern, look at the chart yourself to confirm it actually exists.
Lack of Real-World Context: The AI doesn't know that the Fed Chairman is about to give an important speech, or that a geopolitical conflict just escalated, unless you tell it. Market context is an element where humans still excel over machines.
Overfitting in Backtesting: When optimizing a strategy, an AI can create a system that looks perfect on past data but fails completely in live market conditions. Always be skeptical of backtest results that look "too good to be true."
Your Action Plan: The Journey To Becoming An AI-Powered Trader
Now that you know the applications, here is a roadmap to get you started systematically:
Week 1: The Analytical Foundation

Start with chart analysis using screenshots. Practice with different prompts.
Experiment with multi-timeframe analysis to get a holistic view.
Set up your intelligent trading journal template and log your first trade.
Week 2: Deepening Your Research

Use AI to perform a fundamental analysis of a stock you're following.
Ask AI to "stress-test" your current trading strategy.
Integrate AI into your stock screening process.
Week 3: Advanced Applications

Create your first custom indicator with AI's help.
Choose a favorite indicator and convert it into a backtestable strategy.
Begin optimizing the strategy based on backtest results.
Week 4: Refinement and Systemization

Analyze your trading journal data with AI to find behavioral patterns.
Refine your strategies based on AI feedback and journal analysis.
Build a consistent daily/weekly workflow that incorporates AI.
Final Thoughts
AI isn't just changing trading - it's creating an entirely new playing field. The traders who adapt early and integrate these tools will have an immeasurable advantage over those who stick to the old methods.
The best part is that this playing field has been leveled. You don't need expensive software or advanced technical skills. With the step-by-step processes outlined above, you can start harnessing the power of AI immediately.
Remember, the goal is not to let AI trade for you. The goal is to use AI to:
Analyze markets faster and more objectively.
Spot patterns you might otherwise miss.
Build and test strategies systematically.
Keep records and learn from every trade in a profound way.
The future of trading is here, and it's powered by Artificial Intelligence. Don't get left behind. Start today and watch your trading journey transform.
Ready to take your trading to the next level? Pick one AI application from this guide and try it with your next trade. The difference will be immediate.
If you are interested in other topics and how AI is transforming different aspects of our lives or even in making money using AI with more detailed, step-by-step guidance, you can find our other articles here:
How well did this guide cover the topic of "making money with AI"? |
Reply